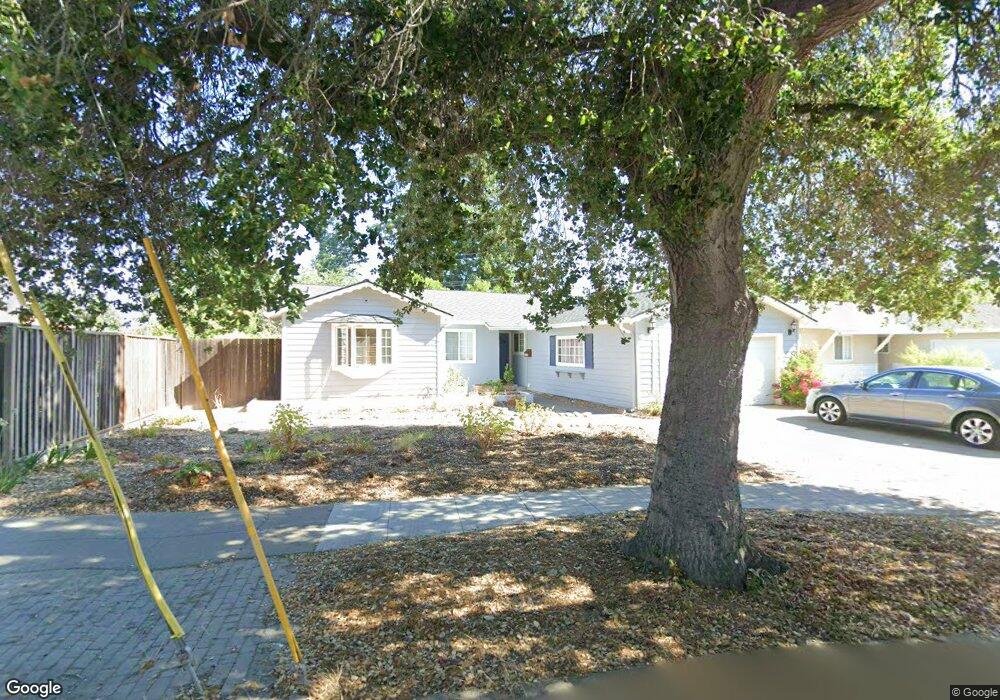
6135 Dial Way San Jose, CA 95129
West San Jose NeighborhoodEstimated Value: $2,618,000 - $3,181,000
4
Beds
2
Baths
1,415
Sq Ft
$2,110/Sq Ft
Est. Value
About This Home
This home is located at 6135 Dial Way, San Jose, CA 95129 and is currently estimated at $2,985,514, approximately $2,109 per square foot. 6135 Dial Way is a home located in Santa Clara County with nearby schools including Nelson S. Dilworth Elementary School, Joaquin Miller Middle, and Lynbrook High School.
Ownership History
Date
Name
Owned For
Owner Type
Purchase Details
Closed on
Dec 4, 2020
Sold by
Chang Hungsen and Chang Zon
Bought by
Chang Anna
Current Estimated Value
Purchase Details
Closed on
May 14, 2007
Sold by
Chang Hungsen and Chang Zon Zon Wendy
Bought by
Chang Hungsen and Chang Zon Zon Wendy
Purchase Details
Closed on
Sep 11, 1997
Sold by
John Zwier and John Mary J
Bought by
Chang Hungsen and Chang Zon Zon
Home Financials for this Owner
Home Financials are based on the most recent Mortgage that was taken out on this home.
Original Mortgage
$320,000
Outstanding Balance
$49,504
Interest Rate
7.45%
Estimated Equity
$2,936,010
Create a Home Valuation Report for This Property
The Home Valuation Report is an in-depth analysis detailing your home's value as well as a comparison with similar homes in the area
Home Values in the Area
Average Home Value in this Area
Purchase History
| Date | Buyer | Sale Price | Title Company |
|---|---|---|---|
| Chang Anna | -- | None Available | |
| Chang Hungsen | -- | None Available | |
| Chang Hungsen | $440,000 | Old Republic Title Company |
Source: Public Records
Mortgage History
| Date | Status | Borrower | Loan Amount |
|---|---|---|---|
| Open | Chang Hungsen | $320,000 |
Source: Public Records
Tax History Compared to Growth
Tax History
| Year | Tax Paid | Tax Assessment Tax Assessment Total Assessment is a certain percentage of the fair market value that is determined by local assessors to be the total taxable value of land and additions on the property. | Land | Improvement |
|---|---|---|---|---|
| 2025 | $9,654 | $702,549 | $447,083 | $255,466 |
| 2024 | $9,654 | $688,774 | $438,317 | $250,457 |
| 2023 | $9,537 | $675,270 | $429,723 | $245,547 |
| 2022 | $9,664 | $662,031 | $421,298 | $240,733 |
| 2021 | $9,500 | $649,051 | $413,038 | $236,013 |
| 2020 | $9,306 | $642,396 | $408,803 | $233,593 |
| 2019 | $9,102 | $629,801 | $400,788 | $229,013 |
| 2018 | $8,850 | $617,453 | $392,930 | $224,523 |
| 2017 | $8,803 | $605,347 | $385,226 | $220,121 |
| 2016 | $8,538 | $593,478 | $377,673 | $215,805 |
| 2015 | $8,481 | $584,564 | $372,000 | $212,564 |
| 2014 | $7,859 | $573,115 | $364,714 | $208,401 |
Source: Public Records
Map
Nearby Homes
- 5635 W Walbrook Dr
- 12035 Brookglen Dr
- 1681 Danromas Way
- 1366 Glenmoor Way
- 1083 Miller Ave
- 1063 Whitebick Dr
- 6117 Brigantine Dr
- 5597 Glenoak Ct
- 18991 Greenbrook Ct
- 6757 Devonshire Dr
- 19349 Northampton Dr
- 1367 Cordelia Ave
- 1017 Craig Dr
- 1018 Huntingdon Dr
- 1154 Bentoak Ln
- 10860 Johnson Ave
- 1040 W Riverside Way
- 1002 Oaktree Dr
- 18796 Westview Dr
- 5177 Englewood Dr