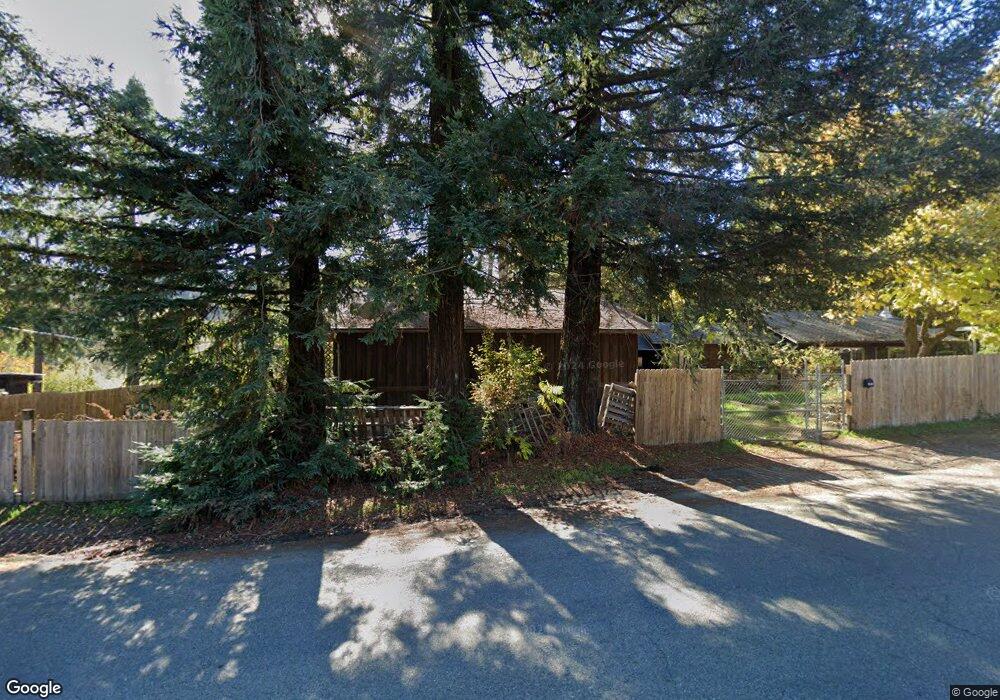
6136 Briceland Thorn Rd Garberville, CA 95542
Estimated Value: $261,000 - $326,000
--
Bed
--
Bath
890
Sq Ft
$323/Sq Ft
Est. Value
About This Home
This home is located at 6136 Briceland Thorn Rd, Garberville, CA 95542 and is currently estimated at $287,125, approximately $322 per square foot. 6136 Briceland Thorn Rd is a home located in Humboldt County.
Ownership History
Date
Name
Owned For
Owner Type
Purchase Details
Closed on
Oct 27, 2014
Sold by
Cox South
Bought by
Kan Jomra C
Current Estimated Value
Home Financials for this Owner
Home Financials are based on the most recent Mortgage that was taken out on this home.
Original Mortgage
$137,200
Interest Rate
4%
Mortgage Type
New Conventional
Purchase Details
Closed on
Nov 15, 2005
Sold by
Glicksman Dana
Bought by
Cox South
Home Financials for this Owner
Home Financials are based on the most recent Mortgage that was taken out on this home.
Original Mortgage
$152,000
Interest Rate
6.07%
Mortgage Type
Fannie Mae Freddie Mac
Purchase Details
Closed on
Nov 24, 1999
Sold by
Day Stuart
Bought by
Glicksman Dana
Home Financials for this Owner
Home Financials are based on the most recent Mortgage that was taken out on this home.
Original Mortgage
$60,000
Interest Rate
8.25%
Purchase Details
Closed on
Oct 14, 1997
Sold by
Day Jean M Revocable Trust and Stuart B
Bought by
Day Stuart and The 1997 Stuart Day Revocable
Create a Home Valuation Report for This Property
The Home Valuation Report is an in-depth analysis detailing your home's value as well as a comparison with similar homes in the area
Home Values in the Area
Average Home Value in this Area
Purchase History
| Date | Buyer | Sale Price | Title Company |
|---|---|---|---|
| Kan Jomra C | $196,000 | Fidelity National Title Co | |
| Cox South | $190,000 | Fidelity National Title Co | |
| Glicksman Dana | $75,000 | Fidelity National Title Co | |
| Day Stuart | -- | -- |
Source: Public Records
Mortgage History
| Date | Status | Borrower | Loan Amount |
|---|---|---|---|
| Previous Owner | Kan Jomra C | $137,200 | |
| Previous Owner | Cox South | $152,000 | |
| Previous Owner | Glicksman Dana | $60,000 |
Source: Public Records
Tax History Compared to Growth
Tax History
| Year | Tax Paid | Tax Assessment Tax Assessment Total Assessment is a certain percentage of the fair market value that is determined by local assessors to be the total taxable value of land and additions on the property. | Land | Improvement |
|---|---|---|---|---|
| 2025 | $3,357 | $235,554 | $120,181 | $115,373 |
| 2024 | $3,357 | $230,936 | $117,825 | $113,111 |
| 2023 | $3,335 | $226,409 | $115,515 | $110,894 |
| 2022 | $3,263 | $221,970 | $113,250 | $108,720 |
| 2021 | $2,975 | $217,619 | $111,030 | $106,589 |
| 2020 | $2,986 | $215,389 | $109,892 | $105,497 |
| 2019 | $2,925 | $211,167 | $107,738 | $103,429 |
| 2018 | $2,881 | $207,027 | $105,626 | $101,401 |
| 2017 | $2,837 | $202,968 | $103,555 | $99,413 |
| 2016 | $2,651 | $198,989 | $101,525 | $97,464 |
| 2015 | -- | $229,679 | $113,703 | $115,976 |
| 2014 | -- | $225,181 | $111,476 | $113,705 |
Source: Public Records
Map
Nearby Homes
- 1000 Reed Loop Rd
- 105 Buck Gulch Ln
- 1520 Elk Ridge Rd
- 000 Reed Mountain Rd
- 2611 Raff Creek Rd
- 3105 China Creek Rd
- 2126 China Creek Rd
- 946 Chinquapin Dr
- 4001 Old Briceland Rd
- 243 Forest Dr
- 273 Forest Dr
- 260 Redway Dr
- 44 Mckenzie Ln
- 95 Oak Ave
- 85 Madrone Ave
- 478 Redway Dr
- 421 Par Ave
- 75 Empire Ave
- 725 725 K Rd
- 64 Pacific Ave
- 6144 Briceland-Thorne Rd
- 6091 Briceland Rd
- 6106 Briceland-Thorne Rd
- 6169 Briceland-Thorne Rd
- 6179 Briceland-Thorne Rd
- 9630 Briceland Rd
- 6070 Briceland Thorn Rd
- 6239 Briceland-Thorne Rd
- 6263 Briceland Thorn Rd
- 6280 Briceland Thorn Rd
- 6285 Briceland-Thorne Rd
- 88 School St
- 6330 Briceland Thorn Rd
- 118 School St
- 6350 Briceland Thorn Rd
- 6378 Briceland Thorn Rd
- 6136 Briceland Thorn Rd
- 6169 Briceland Thorn Rd
- 6525 Briceland Thorne Rd
- 5665 Briceland Thorne Rd