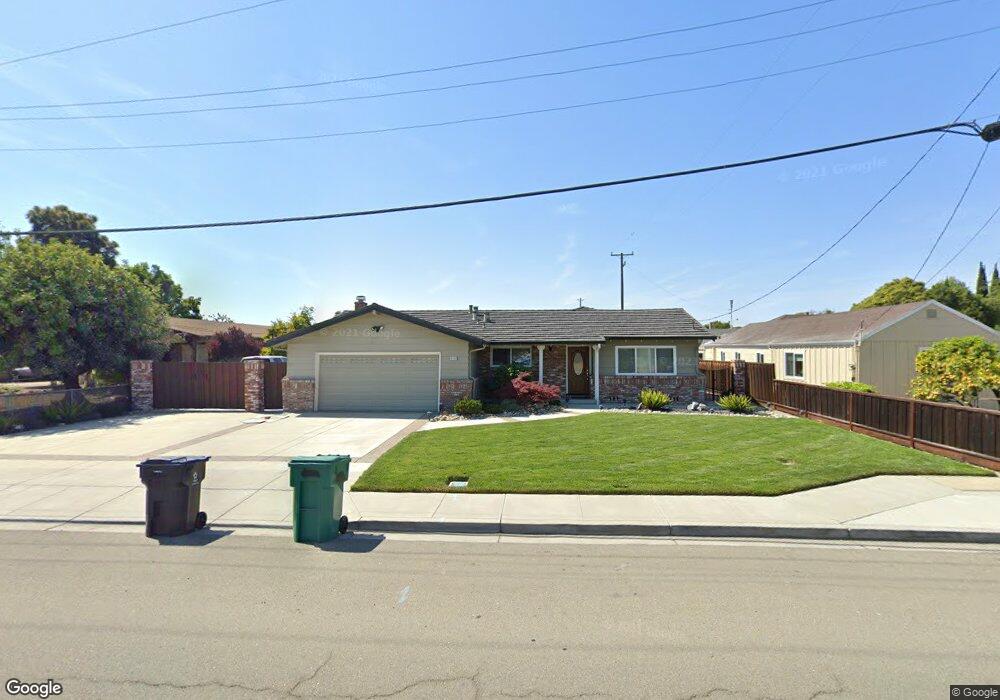
6139 Robertson Ave Newark, CA 94560
Birch Grove NeighborhoodEstimated Value: $1,225,000 - $1,350,000
3
Beds
2
Baths
1,431
Sq Ft
$880/Sq Ft
Est. Value
About This Home
This home is located at 6139 Robertson Ave, Newark, CA 94560 and is currently estimated at $1,259,203, approximately $879 per square foot. 6139 Robertson Ave is a home located in Alameda County with nearby schools including Birch Grove Intermediate School, Newark Junior High School, and Newark Memorial High School.
Ownership History
Date
Name
Owned For
Owner Type
Purchase Details
Closed on
Feb 23, 2021
Sold by
Rapolla Michael Joseph
Bought by
Michael Joseph Rapolla Trust and Rapolla
Current Estimated Value
Purchase Details
Closed on
Jan 20, 2021
Sold by
Amelia M Silvey Trust and Amelia M Silvey Trust
Bought by
Rapolla Michael Joseph
Purchase Details
Closed on
Aug 2, 2013
Sold by
Silvey Amelia M and Trust A Of The Leonard S Silve
Bought by
Silvey Amelia M and Amelia M Silvey Trust
Purchase Details
Closed on
Nov 11, 2011
Sold by
Silvey Amelia M and The Leonard S Silvey & Amelia
Bought by
Silvey Amelia M and The Marital Trust Trust A Of T
Purchase Details
Closed on
Jan 19, 2006
Sold by
Rapolla Amelia Marie and Silvey Amelia
Bought by
Silvey Leonard S and Silvey Amelia M
Purchase Details
Closed on
Dec 9, 2004
Sold by
Rapolla Amelia Marie and Silvey Amelia
Bought by
Rapolla Michael J
Create a Home Valuation Report for This Property
The Home Valuation Report is an in-depth analysis detailing your home's value as well as a comparison with similar homes in the area
Home Values in the Area
Average Home Value in this Area
Purchase History
| Date | Buyer | Sale Price | Title Company |
|---|---|---|---|
| Michael Joseph Rapolla Trust | -- | None Listed On Document | |
| Rapolla Michael Joseph | -- | None Listed On Document | |
| Silvey Amelia M | -- | None Available | |
| Silvey Amelia M | -- | None Available | |
| Silvey Leonard S | -- | None Available | |
| Rapolla Michael J | -- | None Available | |
| Rapolla Michael J | -- | -- |
Source: Public Records
Tax History
| Year | Tax Paid | Tax Assessment Tax Assessment Total Assessment is a certain percentage of the fair market value that is determined by local assessors to be the total taxable value of land and additions on the property. | Land | Improvement |
|---|---|---|---|---|
| 2025 | $1,681 | $81,807 | $23,701 | $58,106 |
| 2024 | $1,681 | $80,204 | $23,237 | $56,967 |
| 2023 | $1,615 | $78,631 | $22,781 | $55,850 |
| 2022 | $1,561 | $77,089 | $22,334 | $54,755 |
| 2021 | $1,529 | $75,200 | $21,518 | $53,682 |
| 2020 | $1,425 | $74,429 | $21,297 | $53,132 |
| 2019 | $1,411 | $72,970 | $20,880 | $52,090 |
| 2018 | $1,384 | $71,539 | $20,470 | $51,069 |
| 2017 | $1,349 | $70,137 | $20,069 | $50,068 |
| 2016 | $1,317 | $68,762 | $19,676 | $49,086 |
| 2015 | $1,311 | $67,729 | $19,380 | $48,349 |
| 2014 | $1,269 | $66,402 | $19,000 | $47,402 |
Source: Public Records
Map
Nearby Homes
- 6257 Honeysuckle Dr
- 37640 Hyacinth St
- 6364 Honeysuckle Dr
- 5859 Central Ave
- 6332 Rockrose Dr
- 38445 Amaranto St
- 38463 Amaranto St
- 38515 Amaranto St
- 38509 Amaranto St
- 38539 Amaranto St
- 5513 Higo Way
- 5550 Higo Way
- 38427 Cedar Blvd
- 5516 Higo Way
- 5502 Higo Way
- 38353 Farwell Dr
- 6245 Thornton Ave
- 5268 Keeler Ct
- 5724 Pandorea Terrace
- 37029 Olive St
- 6147 Robertson Ave
- 6127 Robertson Ave
- 6165 Robertson Ave
- 6184 Pomegranate Ave
- 6119 Robertson Ave
- 6152 Pomegranate Ave
- 6163 Robertson Ave
- 6144 Robertson Ave
- 6132 Robertson Ave
- 6105 Robertson Ave
- 6212 Pomegranate Ave
- 6148 Robertson Ave
- 6136 Pomegranate Ave
- 6128 Robertson Ave
- 6179 Robertson Ave
- 6193 Pomegranate Ave
- 6177 Pomegranate Ave
- 6161 Pomegranate Ave
- 6232 Pomegranate Ave
- 6116 Robertson Ave
Your Personal Tour Guide
Ask me questions while you tour the home.