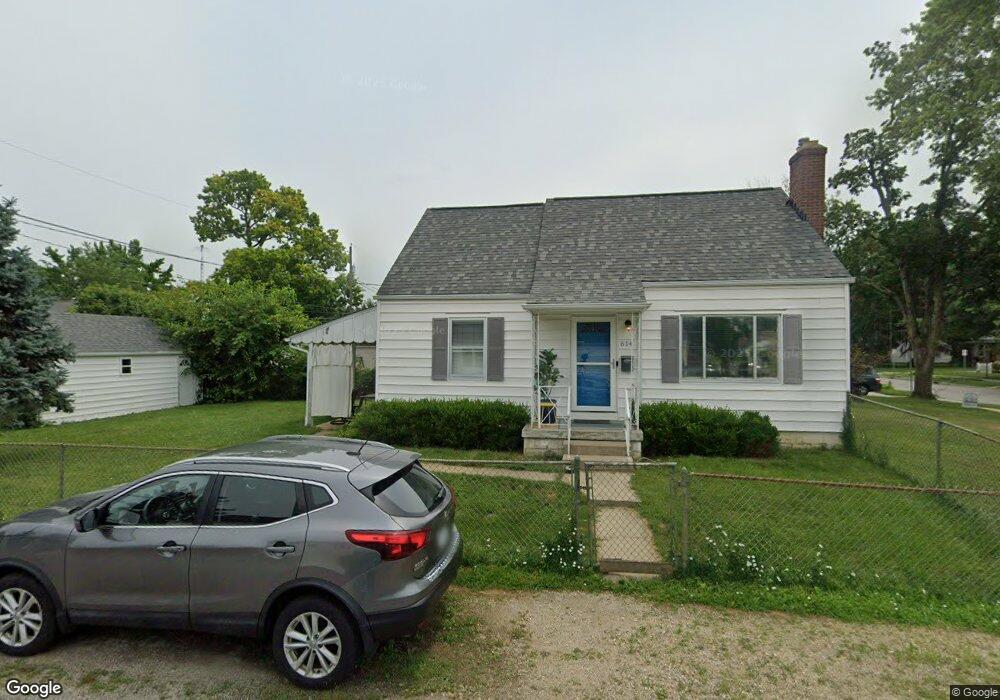
614 E Beechwold Blvd Columbus, OH 43214
Clintonville NeighborhoodEstimated Value: $318,347 - $347,000
3
Beds
1
Bath
1,044
Sq Ft
$321/Sq Ft
Est. Value
About This Home
This home is located at 614 E Beechwold Blvd, Columbus, OH 43214 and is currently estimated at $334,837, approximately $320 per square foot. 614 E Beechwold Blvd is a home located in Franklin County with nearby schools including Colerain Elementary School, Dominion Middle School, and Whetstone High School.
Ownership History
Date
Name
Owned For
Owner Type
Purchase Details
Closed on
Oct 30, 2009
Sold by
Lombardoi Julie and Hollern Julie
Bought by
Krumwiede Peggy A
Current Estimated Value
Home Financials for this Owner
Home Financials are based on the most recent Mortgage that was taken out on this home.
Original Mortgage
$151,701
Outstanding Balance
$97,795
Interest Rate
5.07%
Mortgage Type
FHA
Estimated Equity
$237,042
Purchase Details
Closed on
Aug 14, 2007
Sold by
Redding Beverly R and Redding Kenneth R
Bought by
Hollern Julie
Home Financials for this Owner
Home Financials are based on the most recent Mortgage that was taken out on this home.
Original Mortgage
$120,000
Interest Rate
6.79%
Mortgage Type
Purchase Money Mortgage
Purchase Details
Closed on
Oct 13, 2006
Sold by
Gallardo Sally A and Gallardo Edward Arnold
Bought by
Redding Kenneth R and Redding Beverly R
Purchase Details
Closed on
Dec 7, 1988
Bought by
Gergalunas Mary L Le
Purchase Details
Closed on
Feb 1, 1986
Create a Home Valuation Report for This Property
The Home Valuation Report is an in-depth analysis detailing your home's value as well as a comparison with similar homes in the area
Home Values in the Area
Average Home Value in this Area
Purchase History
| Date | Buyer | Sale Price | Title Company |
|---|---|---|---|
| Krumwiede Peggy A | $154,500 | Talon Title | |
| Hollern Julie | $150,000 | Talon Group | |
| Redding Kenneth R | $119,000 | Talon Group | |
| Gergalunas Mary L Le | -- | -- | |
| -- | -- | -- |
Source: Public Records
Mortgage History
| Date | Status | Borrower | Loan Amount |
|---|---|---|---|
| Open | Krumwiede Peggy A | $151,701 | |
| Previous Owner | Hollern Julie | $120,000 |
Source: Public Records
Tax History
| Year | Tax Paid | Tax Assessment Tax Assessment Total Assessment is a certain percentage of the fair market value that is determined by local assessors to be the total taxable value of land and additions on the property. | Land | Improvement |
|---|---|---|---|---|
| 2025 | $4,166 | $92,830 | $36,160 | $56,670 |
| 2024 | $4,166 | $92,830 | $36,160 | $56,670 |
| 2023 | $4,113 | $92,820 | $36,155 | $56,665 |
| 2022 | $3,921 | $75,600 | $21,910 | $53,690 |
| 2021 | $3,928 | $75,600 | $21,910 | $53,690 |
| 2020 | $3,933 | $75,600 | $21,910 | $53,690 |
| 2019 | $3,525 | $58,110 | $16,840 | $41,270 |
| 2018 | $3,225 | $58,110 | $16,840 | $41,270 |
| 2017 | $3,396 | $58,110 | $16,840 | $41,270 |
| 2016 | $3,269 | $49,350 | $14,070 | $35,280 |
| 2015 | $2,932 | $48,760 | $14,070 | $34,690 |
| 2014 | $2,939 | $48,760 | $14,070 | $34,690 |
| 2013 | $1,381 | $46,445 | $13,405 | $33,040 |
Source: Public Records
Map
Nearby Homes
- 601 Morse Rd
- 435 E Beaumont Rd
- 4605 Glenmawr Ave
- 389 Wetmore Rd
- 827 Inwood Place
- 4299 Colerain Ave
- 899 Meadowview Dr
- 144 Wetmore Rd
- 243 E Schreyer Place
- 103 E Jeffrey Place
- 1144 Reed Circle Dr
- 390 Lenappe Dr
- 151 W Dominion Blvd
- 53 E Beechwold Blvd
- 1116 Tulsa Dr
- 1130 Carbone Dr
- 5301 Indianola Ave
- 62 W Rathbone Ave
- 4983 Almont Dr
- 1310 Fowler Dr
- 620 E Beechwold Blvd
- 624 E Beechwold Blvd
- 602 E Beechwold Blvd
- 630 E Beechwold Blvd
- 598 E Beechwold Blvd
- 613 E Royal Forest Blvd
- 619 E Royal Forest Blvd
- 623 E Royal Forest Blvd
- 592 E Beechwold Blvd
- 601 E Royal Forest Blvd
- 640 E Beechwold Blvd
- 629 E Royal Forest Blvd
- 597 E Royal Forest Blvd
- 613 E Beechwold Blvd
- 619 E Beechwold Blvd
- 586 E Beechwold Blvd
- 635 E Royal Forest Blvd
- 601 E Beechwold Blvd
- 623 E Beechwold Blvd
- 597 E Beechwold Blvd
Your Personal Tour Guide
Ask me questions while you tour the home.