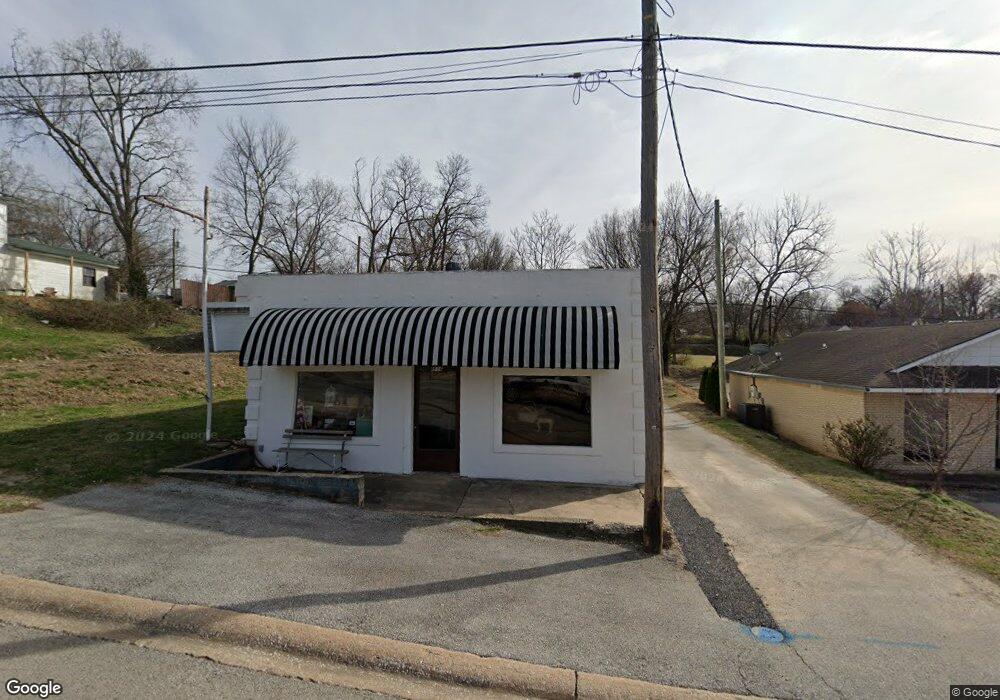
614 E Main St Siloam Springs, AR 72761
Estimated Value: $96,997
--
Bed
--
Bath
1,400
Sq Ft
$69/Sq Ft
Est. Value
About This Home
This home is located at 614 E Main St, Siloam Springs, AR 72761 and is currently estimated at $96,997, approximately $69 per square foot. 614 E Main St is a home located in Benton County with nearby schools including Northside Elementary School, Southside Elementary School, and Delbert Pete & Pat Allen Elementary School.
Ownership History
Date
Name
Owned For
Owner Type
Purchase Details
Closed on
Apr 28, 2017
Sold by
Proffitt Dennis L and Proffitt Roberta S
Bought by
Perryman Bobby L and Perryman Cassandra L
Current Estimated Value
Home Financials for this Owner
Home Financials are based on the most recent Mortgage that was taken out on this home.
Original Mortgage
$45,525
Outstanding Balance
$30,954
Interest Rate
4.3%
Mortgage Type
Future Advance Clause Open End Mortgage
Estimated Equity
$66,043
Purchase Details
Closed on
Jul 23, 2004
Bought by
Proffitt
Purchase Details
Closed on
Jul 15, 2004
Bought by
Proffitt
Purchase Details
Closed on
Dec 12, 2003
Bought by
Drc Invest
Purchase Details
Closed on
Aug 6, 2003
Bought by
Bank Of Siloam
Purchase Details
Closed on
Jan 6, 2003
Bought by
Burman
Purchase Details
Closed on
Dec 5, 1994
Bought by
Exceen
Purchase Details
Closed on
Mar 2, 1993
Bought by
Reed
Purchase Details
Closed on
Mar 1, 1976
Bought by
Douthit
Create a Home Valuation Report for This Property
The Home Valuation Report is an in-depth analysis detailing your home's value as well as a comparison with similar homes in the area
Home Values in the Area
Average Home Value in this Area
Purchase History
| Date | Buyer | Sale Price | Title Company |
|---|---|---|---|
| Perryman Bobby L | $56,400 | Waco Title Company | |
| Proffitt | $80,000 | -- | |
| Proffitt | $80,000 | -- | |
| Drc Invest | $35,000 | -- | |
| Bank Of Siloam | -- | -- | |
| Burman | -- | -- | |
| Exceen | $27,000 | -- | |
| Reed | $15,400 | -- | |
| Douthit | -- | -- | |
| Douthit | $24,000 | -- |
Source: Public Records
Mortgage History
| Date | Status | Borrower | Loan Amount |
|---|---|---|---|
| Open | Perryman Bobby L | $45,525 |
Source: Public Records
Tax History Compared to Growth
Tax History
| Year | Tax Paid | Tax Assessment Tax Assessment Total Assessment is a certain percentage of the fair market value that is determined by local assessors to be the total taxable value of land and additions on the property. | Land | Improvement |
|---|---|---|---|---|
| 2025 | $930 | $23,971 | $6,013 | $17,958 |
| 2024 | $876 | $23,971 | $6,013 | $17,958 |
| 2023 | $796 | $13,820 | $2,960 | $10,860 |
| 2022 | $795 | $13,820 | $2,960 | $10,860 |
| 2021 | $793 | $13,820 | $2,960 | $10,860 |
| 2020 | $781 | $13,560 | $2,960 | $10,600 |
| 2019 | $781 | $13,560 | $2,960 | $10,600 |
| 2018 | $781 | $13,560 | $2,960 | $10,600 |
| 2017 | $781 | $13,560 | $2,960 | $10,600 |
| 2016 | $781 | $13,560 | $2,960 | $10,600 |
| 2015 | $805 | $13,970 | $2,960 | $11,010 |
| 2014 | $805 | $13,970 | $2,960 | $11,010 |
Source: Public Records
Map
Nearby Homes
- 101 E Central St
- 607 E Delaware St
- 1.94 AC Lot 2 S Britt St
- 3 AC Lot 1 S Britt St
- 4.94 AC Lots 1 & 2 S Britt St
- 509 S Washington St
- 110 N Gunter St
- 403 E University St
- 506 E Ashley St
- 515 S Washington St
- 120 N Gunter St
- 0 Tbd St Andrews
- 210 E Ashley St
- 414 N Maxwell St
- 716 S Washington St
- 517 N Madison St
- 624 S Hico St
- 114 S College St
- 704 S Hico St
- TBD E Main St
- 618 Main St
- 622 E Main St
- 600 E Main St
- 615 E Twin Springs St
- 619 E Twin Springs St
- 702 E Main St
- 623 E Twin Springs St
- 607 E Main St
- 621 E Main St
- 704 E Main St
- 701 E Twin Springs St
- 705 E Twin Springs St
- 708 E Main St
- 709 E Main St
- 711 E Twin Springs St
- 606 1/2 E Central St
- 710 E Main St
- 620 E Twin Springs St
- 608 E Twin Springs St
- 618 E Central St