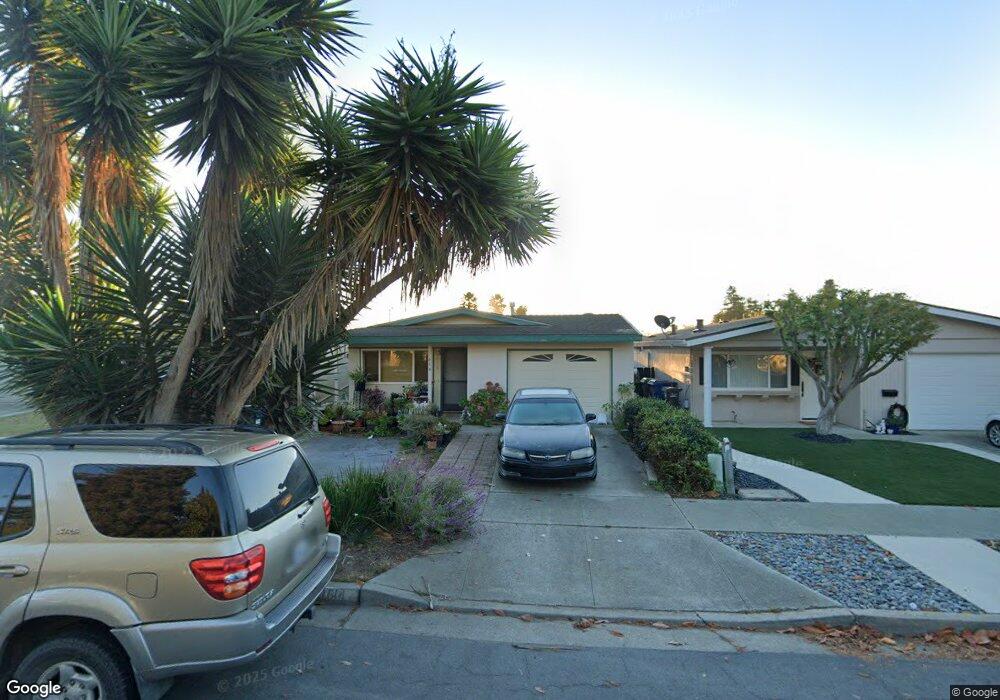
614 Ester Way Watsonville, CA 95076
Estimated Value: $506,000 - $539,000
2
Beds
1
Bath
892
Sq Ft
$583/Sq Ft
Est. Value
About This Home
This home is located at 614 Ester Way, Watsonville, CA 95076 and is currently estimated at $519,796, approximately $582 per square foot. 614 Ester Way is a home located in Santa Cruz County with nearby schools including Ann Soldo Elementary School, Lakeview Middle School, and Watsonville High School.
Ownership History
Date
Name
Owned For
Owner Type
Purchase Details
Closed on
Jun 10, 2013
Sold by
Pereira Nedio A and Pereira Fatima A
Bought by
Pereira Nedio A and Pereira Fatima A
Current Estimated Value
Purchase Details
Closed on
Dec 13, 2000
Sold by
Riordan Patrick M
Bought by
Pereira Nedio A and Pereira Fatima A
Home Financials for this Owner
Home Financials are based on the most recent Mortgage that was taken out on this home.
Original Mortgage
$136,000
Outstanding Balance
$50,153
Interest Rate
7.71%
Estimated Equity
$469,643
Create a Home Valuation Report for This Property
The Home Valuation Report is an in-depth analysis detailing your home's value as well as a comparison with similar homes in the area
Home Values in the Area
Average Home Value in this Area
Purchase History
| Date | Buyer | Sale Price | Title Company |
|---|---|---|---|
| Pereira Nedio A | -- | None Available | |
| Pereira Nedio A | $189,000 | First American Title Co |
Source: Public Records
Mortgage History
| Date | Status | Borrower | Loan Amount |
|---|---|---|---|
| Open | Pereira Nedio A | $136,000 |
Source: Public Records
Tax History
| Year | Tax Paid | Tax Assessment Tax Assessment Total Assessment is a certain percentage of the fair market value that is determined by local assessors to be the total taxable value of land and additions on the property. | Land | Improvement |
|---|---|---|---|---|
| 2025 | $3,560 | $284,796 | $170,878 | $113,918 |
| 2023 | $3,504 | $273,737 | $164,242 | $109,495 |
| 2022 | $3,438 | $268,370 | $161,022 | $107,348 |
| 2021 | $3,197 | $263,108 | $157,865 | $105,243 |
| 2020 | $3,151 | $260,410 | $156,246 | $104,164 |
| 2019 | $3,096 | $255,303 | $153,182 | $102,121 |
| 2018 | $3,018 | $250,298 | $150,179 | $100,119 |
| 2017 | $2,992 | $245,390 | $147,234 | $98,156 |
| 2016 | $2,914 | $240,578 | $144,347 | $96,231 |
| 2015 | $2,904 | $236,965 | $142,179 | $94,786 |
| 2014 | $2,693 | $219,648 | $131,789 | $87,859 |
Source: Public Records
Map
Nearby Homes
- 608 Bronte Ave
- 8 Carita Ct
- 227 Hushbeck Ave
- 501 Cedar Dr
- 624 Delta Way
- 563 Argos Cir
- 501 Tuttle Ave
- 525 Cloudview Dr
- 450 Beck St
- 738 Cynthia Ct
- 498 Suncrest Way
- 535 Joyce Dr
- 30 Riverside Rd
- 708 Hill Ave
- 729 Vista Montana Dr
- 718 Roble St
- 140 E Riverside Dr
- 124 Gonda St
- 128 Maple Ave
- 215 Palm Ave Unit A
Your Personal Tour Guide
Ask me questions while you tour the home.