Estimated Value: $364,000 - $457,000
1
Bed
1
Bath
456
Sq Ft
$881/Sq Ft
Est. Value
About This Home
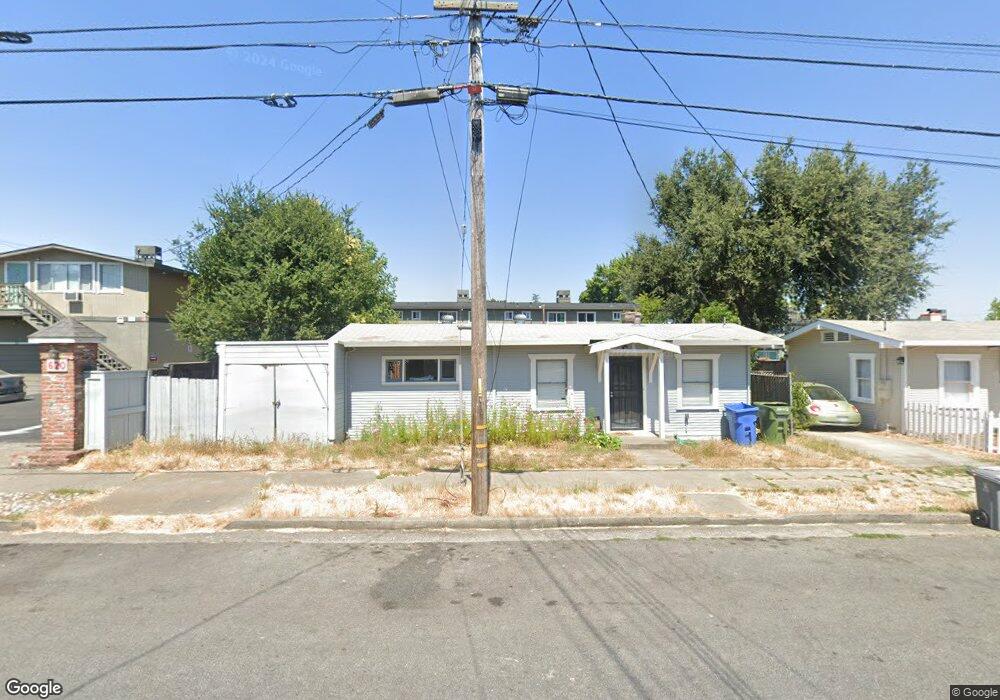
This home is located at 614 G St, Petaluma, CA 94952 and is currently estimated at $401,644, approximately $880 per square foot. 614 G St is a home located in Sonoma County with nearby schools including McNear Elementary School, Petaluma Junior High School, and Petaluma High School.
Ownership History
Date
Name
Owned For
Owner Type
Purchase Details
Closed on
Mar 20, 2025
Sold by
Silacci-Lewis Trust and Silacci Dan William
Bought by
Cronkright Chase and Cronkright Rinko
Current Estimated Value
Home Financials for this Owner
Home Financials are based on the most recent Mortgage that was taken out on this home.
Original Mortgage
$300,000
Outstanding Balance
$298,470
Interest Rate
6.89%
Mortgage Type
New Conventional
Estimated Equity
$103,174
Purchase Details
Closed on
Nov 7, 2020
Sold by
Silacci David L and Silacci David
Bought by
Silacci-Lewis Trust and Silacci
Purchase Details
Closed on
Mar 16, 2017
Sold by
Pittler Arlyn J
Bought by
Pittler Arlyn J and The Arlyn J Pittler 2017 Trust
Purchase Details
Closed on
Dec 24, 2015
Sold by
Silacci David L and Pittler Arlyn J
Bought by
Silacci David L and Pittler Arlyn J
Purchase Details
Closed on
Apr 30, 2009
Sold by
Silacci Lloyd H and The Silacci Trust
Bought by
Silacci Lloyd H and The Silacci Trust
Create a Home Valuation Report for This Property
The Home Valuation Report is an in-depth analysis detailing your home's value as well as a comparison with similar homes in the area
Home Values in the Area
Average Home Value in this Area
Purchase History
| Date | Buyer | Sale Price | Title Company |
|---|---|---|---|
| Cronkright Chase | $375,000 | Fidelity National Title Compan | |
| Silacci-Lewis Trust | -- | None Listed On Document | |
| Silacci David | -- | None Available | |
| Pittler Arlyn J | -- | None Available | |
| Silacci David L | -- | None Available | |
| Silacci Lloyd H | -- | None Available |
Source: Public Records
Mortgage History
| Date | Status | Borrower | Loan Amount |
|---|---|---|---|
| Open | Cronkright Chase | $300,000 |
Source: Public Records
Tax History
| Year | Tax Paid | Tax Assessment Tax Assessment Total Assessment is a certain percentage of the fair market value that is determined by local assessors to be the total taxable value of land and additions on the property. | Land | Improvement |
|---|---|---|---|---|
| 2025 | $5,190 | $438,600 | $168,300 | $270,300 |
| 2024 | $2,900 | $248,512 | $107,292 | $141,220 |
| 2023 | $2,900 | $243,640 | $105,189 | $138,451 |
| 2022 | $2,756 | $238,864 | $103,127 | $135,737 |
| 2021 | $2,706 | $234,181 | $101,105 | $133,076 |
| 2020 | $1,079 | $83,561 | $50,138 | $33,423 |
| 2019 | $1,067 | $81,923 | $49,155 | $32,768 |
| 2018 | $1,064 | $80,318 | $48,192 | $32,126 |
| 2017 | $1,044 | $78,745 | $47,248 | $31,497 |
| 2016 | $1,012 | $77,202 | $46,322 | $30,880 |
| 2015 | $1,000 | $76,044 | $45,627 | $30,417 |
| 2014 | $996 | $74,556 | $44,734 | $29,822 |
Source: Public Records
Map
Nearby Homes
- 617 G St
- 519 7th St
- 720 Petaluma Blvd S Unit 28
- 21 Branching Way
- 137 F St
- 486 1st St
- 853 D St
- 7 Lavender Terrace
- 626 Sunnyslope Ave
- 888 Petaluma Blvd S
- 156 Grant Ct
- 1309 D Street Extension
- 0 Lakeville St
- 315 Lakeville St
- 131 Liberty St
- 512 Mcnear Ave
- 136 Court St
- 2083 Easton Dr
- 301 Broadway St
- 400 Smith Ct
Your Personal Tour Guide
Ask me questions while you tour the home.