Estimated Value: $119,000 - $160,000
2
Beds
2
Baths
1,104
Sq Ft
$130/Sq Ft
Est. Value
About This Home
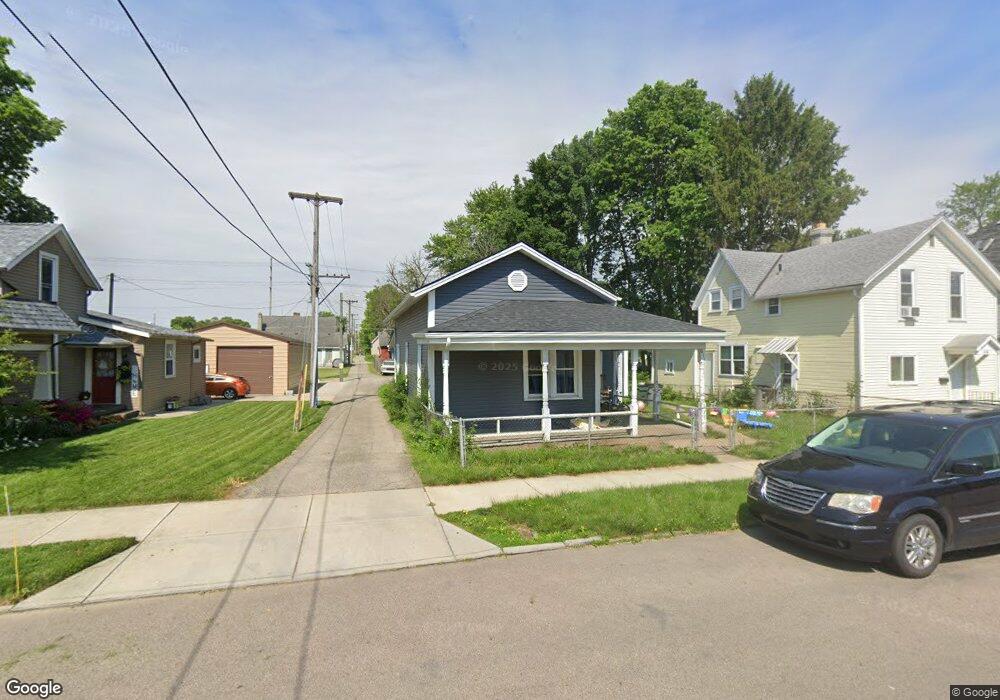
This home is located at 614 S Clay St, Troy, OH 45373 and is currently estimated at $143,736, approximately $130 per square foot. 614 S Clay St is a home located in Miami County with nearby schools including Kyle Elementary School, Van Cleve Elementary School, and Troy Junior High School.
Ownership History
Date
Name
Owned For
Owner Type
Purchase Details
Closed on
May 15, 2003
Sold by
Union Federal Bank Of Indianapolis
Bought by
Hicks Dexter E and Hicks Audrey J
Current Estimated Value
Home Financials for this Owner
Home Financials are based on the most recent Mortgage that was taken out on this home.
Original Mortgage
$32,400
Outstanding Balance
$13,546
Interest Rate
5.87%
Mortgage Type
New Conventional
Estimated Equity
$130,190
Purchase Details
Closed on
Oct 25, 2002
Sold by
Dysinger Matthew R
Bought by
Union Federal Bank Of Indianapolis
Purchase Details
Closed on
Jul 25, 2001
Sold by
Elco & Associates Inc
Bought by
Dysinger Matthew R
Home Financials for this Owner
Home Financials are based on the most recent Mortgage that was taken out on this home.
Original Mortgage
$59,369
Interest Rate
7.16%
Mortgage Type
FHA
Purchase Details
Closed on
Jul 1, 1991
Bought by
Elco & Associates Inc
Create a Home Valuation Report for This Property
The Home Valuation Report is an in-depth analysis detailing your home's value as well as a comparison with similar homes in the area
Home Values in the Area
Average Home Value in this Area
Purchase History
| Date | Buyer | Sale Price | Title Company |
|---|---|---|---|
| Hicks Dexter E | $36,000 | -- | |
| Union Federal Bank Of Indianapolis | $50,000 | -- | |
| Dysinger Matthew R | $59,900 | -- | |
| Elco & Associates Inc | $21,000 | -- |
Source: Public Records
Mortgage History
| Date | Status | Borrower | Loan Amount |
|---|---|---|---|
| Open | Dysinger Matthew R | $32,400 | |
| Previous Owner | Dysinger Matthew R | $59,369 |
Source: Public Records
Tax History
| Year | Tax Paid | Tax Assessment Tax Assessment Total Assessment is a certain percentage of the fair market value that is determined by local assessors to be the total taxable value of land and additions on the property. | Land | Improvement |
|---|---|---|---|---|
| 2025 | $1,499 | $42,570 | $10,540 | $32,030 |
| 2024 | $1,499 | $29,020 | $11,410 | $17,610 |
| 2023 | $1,120 | $29,020 | $11,410 | $17,610 |
| 2022 | $937 | $29,020 | $11,410 | $17,610 |
| 2021 | $760 | $22,340 | $8,790 | $13,550 |
| 2020 | $761 | $22,340 | $8,790 | $13,550 |
| 2019 | $768 | $22,340 | $8,790 | $13,550 |
| 2018 | $829 | $23,210 | $9,490 | $13,720 |
| 2017 | $838 | $23,210 | $9,490 | $13,720 |
| 2016 | $826 | $23,210 | $9,490 | $13,720 |
| 2015 | $799 | $21,500 | $8,790 | $12,710 |
| 2014 | $799 | $21,500 | $8,790 | $12,710 |
| 2013 | $804 | $21,500 | $8,790 | $12,710 |
Source: Public Records
Map
Nearby Homes
- 712 S Clay St
- 436 S Clay St
- 504 S Market St
- 517 S Cherry St
- 67 W Dakota St
- 408 S Market St
- 424 S Counts St
- 996 Stony Brook Ln
- 28 W Canal St
- 103 S Crawford St
- 118 S Walnut St
- 619 E Canal St
- 216 S Short St
- 19 S Cherry St
- 510 Drury Ln
- 385 W Ross St
- 920 Old Nursery Trail
- 119 Morehead St
- 339 Lincoln Ave
- 509 Mckaig Ave
- 608 S Clay St
- 620 S Clay St
- 604 S Clay St
- 713 S Mulberry St
- 707 S Mulberry St
- 719 S Mulberry St
- 703 S Mulberry St
- 725 S Mulberry St
- 624 S Clay St Unit R
- 624 S Clay St Unit 624
- 539 S Mulberry St
- 530 S Clay St
- 533 S Mulberry St
- 525 S Clay St
- 526 S Clay St
- 604 S Crawford St
- 704 S Clay St
- 529 S Mulberry St
- 708 S Mulberry St
- 704 S Mulberry St
Your Personal Tour Guide
Ask me questions while you tour the home.