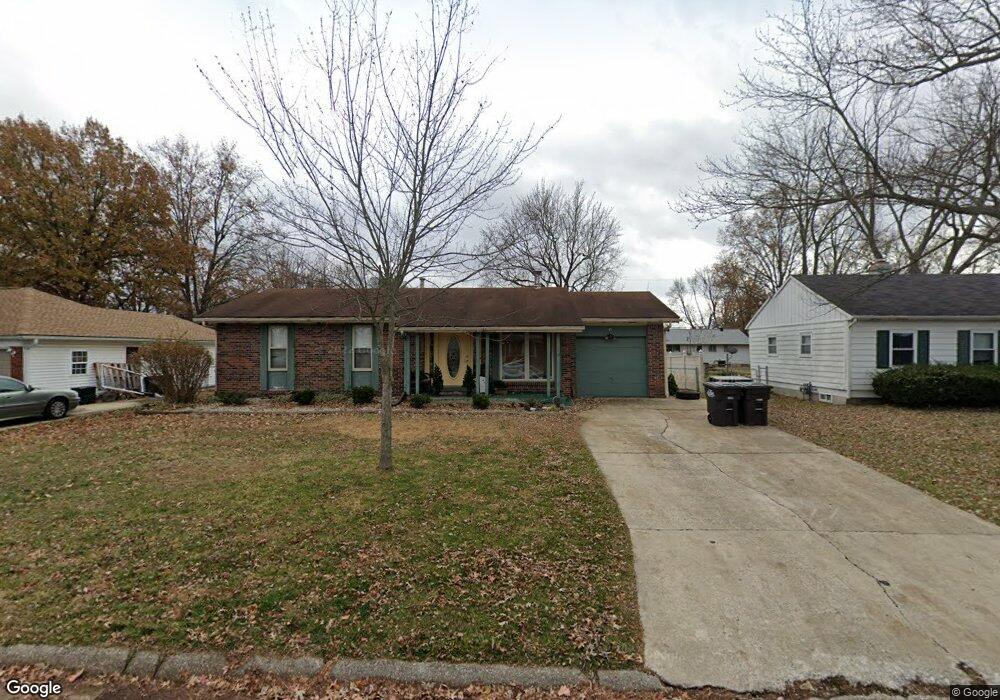
614 Saint Paul Dr Godfrey, IL 62035
Estimated Value: $152,865 - $188,000
5
Beds
2
Baths
950
Sq Ft
$178/Sq Ft
Est. Value
About This Home
This home is located at 614 Saint Paul Dr, Godfrey, IL 62035 and is currently estimated at $168,966, approximately $177 per square foot. 614 Saint Paul Dr is a home located in Madison County with nearby schools including Lewis & Clark Elementary School, Alton Middle School, and Alton High School.
Ownership History
Date
Name
Owned For
Owner Type
Purchase Details
Closed on
Jun 9, 2023
Sold by
Kochanski Theodore J and Kochanski Alicia N
Bought by
Pruitt Joseph
Current Estimated Value
Home Financials for this Owner
Home Financials are based on the most recent Mortgage that was taken out on this home.
Original Mortgage
$94,000
Outstanding Balance
$91,302
Interest Rate
6%
Mortgage Type
Purchase Money Mortgage
Estimated Equity
$77,664
Purchase Details
Closed on
Feb 9, 2021
Sold by
Kelly Lela
Bought by
Kochanski Theodore J and Kochanski Alicia N
Purchase Details
Closed on
May 1, 2009
Sold by
Lorts Terry Shane
Bought by
Kelly Lela and Pruitt Angela
Purchase Details
Closed on
Mar 23, 2004
Sold by
Grigg Judith E
Bought by
Lorts Terry Shane
Home Financials for this Owner
Home Financials are based on the most recent Mortgage that was taken out on this home.
Original Mortgage
$102,860
Interest Rate
5.74%
Mortgage Type
FHA
Create a Home Valuation Report for This Property
The Home Valuation Report is an in-depth analysis detailing your home's value as well as a comparison with similar homes in the area
Home Values in the Area
Average Home Value in this Area
Purchase History
| Date | Buyer | Sale Price | Title Company |
|---|---|---|---|
| Pruitt Joseph | $114,000 | Serenity Title & Escrow | |
| Kochanski Theodore J | -- | None Available | |
| Kelly Lela | $115,500 | Serenity Title & Escrow Ltd | |
| Lorts Terry Shane | $104,500 | Chicago Title |
Source: Public Records
Mortgage History
| Date | Status | Borrower | Loan Amount |
|---|---|---|---|
| Open | Pruitt Joseph | $94,000 | |
| Previous Owner | Lorts Terry Shane | $102,860 |
Source: Public Records
Tax History Compared to Growth
Tax History
| Year | Tax Paid | Tax Assessment Tax Assessment Total Assessment is a certain percentage of the fair market value that is determined by local assessors to be the total taxable value of land and additions on the property. | Land | Improvement |
|---|---|---|---|---|
| 2024 | $3,240 | $48,060 | $4,990 | $43,070 |
| 2023 | $3,240 | $44,370 | $4,610 | $39,760 |
| 2022 | $3,095 | $40,580 | $4,220 | $36,360 |
| 2021 | $2,863 | $38,460 | $3,970 | $34,490 |
| 2020 | $2,812 | $37,620 | $3,880 | $33,740 |
| 2019 | $2,881 | $36,640 | $3,780 | $32,860 |
| 2018 | $2,838 | $35,080 | $3,620 | $31,460 |
| 2017 | $2,629 | $33,950 | $3,620 | $30,330 |
| 2016 | $2,554 | $33,950 | $3,620 | $30,330 |
| 2015 | $1,530 | $32,890 | $3,510 | $29,380 |
| 2014 | $1,530 | $32,890 | $3,510 | $29,380 |
| 2013 | $1,530 | $32,890 | $3,510 | $29,380 |
Source: Public Records
Map
Nearby Homes
- 421 Saint John Dr
- 5707 Humbert Rd
- 223 Bachman Ln
- 123 Tolle Ln
- 5667 Humbert Rd
- 5661 Humbert Rd
- 0 Humbert Rd Unit MIS25052876
- 5775 Roach Rd
- 504 Elm St
- 00 Pine Ridge Lot#52 Dr
- 212 Pine Ridge Dr
- 607 Mulberry St
- 4805 Wick Mor Dr
- 709 Stamper Ln
- 709 Pardee Rd
- 5510 Lamotte Ln
- 5310 Godfrey Rd Unit 12
- 5310 Godfrey Rd Unit 16
- 5310 Godfrey Rd Unit 2
- 4814 Azalea Place Unit 2
- 614 St Paul Dr
- 612 Saint Paul Dr
- 616 Saint Paul Dr
- 616 St Paul
- 615 Saint Anthony Dr
- 617 Saint Anthony Dr
- 610 Saint Paul Dr
- 618 Saint Paul Dr
- 610 St Paul Dr
- 613 Saint Anthony Dr
- 611 Saint Anthony Dr
- 619 Saint Anthony Dr
- 615 Saint Paul Dr
- 613 Saint Paul Dr
- 617 Saint Paul Dr
- 608 Saint Paul Dr
- 620 Saint Paul Dr
- 621 Saint Anthony Dr
- 611 Saint Paul Dr
- 609 Saint Anthony Dr