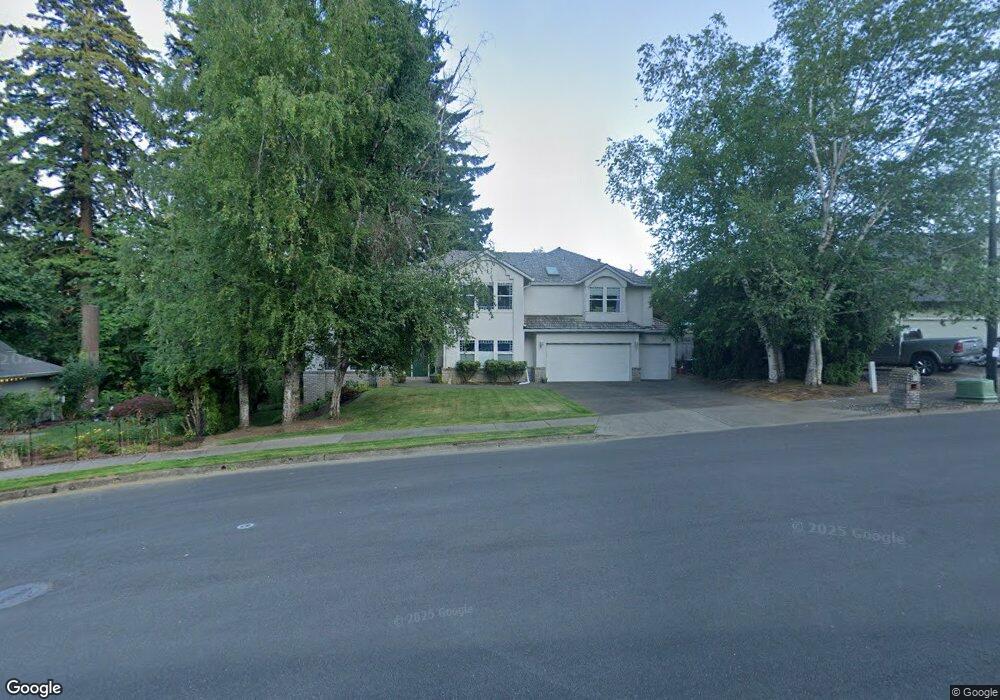
614 SE 14th Ct Gresham, OR 97080
Gresham Butte NeighborhoodEstimated Value: $635,000 - $933,000
4
Beds
8
Baths
3,100
Sq Ft
$254/Sq Ft
Est. Value
About This Home
This home is located at 614 SE 14th Ct, Gresham, OR 97080 and is currently estimated at $788,616, approximately $254 per square foot. 614 SE 14th Ct is a home located in Multnomah County with nearby schools including East Gresham Elementary School, Dexter McCarty Middle School, and Gresham High School.
Ownership History
Date
Name
Owned For
Owner Type
Purchase Details
Closed on
Nov 12, 2025
Sold by
Wise Sara A
Bought by
Choonoo Family Trust and Wise
Current Estimated Value
Purchase Details
Closed on
Jul 30, 2001
Sold by
Noe Jerry D
Bought by
Choonoo Jeffery T and Wise Sara A
Home Financials for this Owner
Home Financials are based on the most recent Mortgage that was taken out on this home.
Original Mortgage
$255,900
Interest Rate
7.09%
Mortgage Type
Purchase Money Mortgage
Purchase Details
Closed on
May 11, 1999
Sold by
Noe Jerry D
Bought by
Noe Jerry D and Noe Teresa L Nugent
Home Financials for this Owner
Home Financials are based on the most recent Mortgage that was taken out on this home.
Original Mortgage
$232,000
Interest Rate
6.94%
Mortgage Type
Purchase Money Mortgage
Purchase Details
Closed on
May 8, 1997
Sold by
American Investments Trust
Bought by
Noe Jerry J and Nugent Teresa L
Purchase Details
Closed on
Jan 1, 1995
Sold by
Noe Jerry
Bought by
American Investments Trust and Estates Management Services
Create a Home Valuation Report for This Property
The Home Valuation Report is an in-depth analysis detailing your home's value as well as a comparison with similar homes in the area
Home Values in the Area
Average Home Value in this Area
Purchase History
| Date | Buyer | Sale Price | Title Company |
|---|---|---|---|
| Choonoo Family Trust | -- | None Listed On Document | |
| Choonoo Jeffery T | $319,900 | Chicago Title Insurance Co | |
| Noe Jerry D | -- | Oregon Title Insurance Co | |
| Noe Jerry J | -- | Stewart Title | |
| American Investments Trust | -- | -- |
Source: Public Records
Mortgage History
| Date | Status | Borrower | Loan Amount |
|---|---|---|---|
| Previous Owner | Choonoo Jeffery T | $255,900 | |
| Previous Owner | Noe Jerry D | $232,000 | |
| Closed | Choonoo Jeffery T | $31,900 |
Source: Public Records
Tax History
| Year | Tax Paid | Tax Assessment Tax Assessment Total Assessment is a certain percentage of the fair market value that is determined by local assessors to be the total taxable value of land and additions on the property. | Land | Improvement |
|---|---|---|---|---|
| 2025 | $10,223 | $502,390 | -- | -- |
| 2024 | $9,786 | $487,760 | -- | -- |
| 2023 | $8,916 | $473,560 | $0 | $0 |
| 2022 | $8,667 | $459,770 | $0 | $0 |
| 2021 | $8,448 | $446,380 | $0 | $0 |
| 2020 | $7,949 | $433,380 | $0 | $0 |
| 2019 | $7,741 | $420,760 | $0 | $0 |
| 2018 | $7,381 | $408,510 | $0 | $0 |
| 2017 | $7,081 | $396,620 | $0 | $0 |
| 2016 | $6,244 | $385,070 | $0 | $0 |
| 2015 | $6,040 | $373,860 | $0 | $0 |
| 2014 | $5,798 | $362,980 | $0 | $0 |
Source: Public Records
Map
Nearby Homes
- 511 SE 15th St
- 1414 SE Beech Place
- 55 SW Lovhar Dr
- 1918 SE Regner Rd
- 0 SW Miller Ct Unit 470855683
- 2024 SE Spruce Ave
- 2440 SE Regner Rd
- 417 SE Roberts Ave
- 1407 SW Walters Dr
- 415 SE Roberts Ave
- 2581 SE Morlan Way
- 1949 SE Palmquist Rd Unit 51
- 1949 SE Palmquist Rd Unit 91
- 1949 SE Palmquist Rd Unit 121
- 1696 SE 26th Dr
- 2137 SE 15th Aly
- 2678 SE Myrtlewood Way
- 242 SE 29th St
- 1715 SE 5th St Unit 1725
- 2909 SE Liberty Place
- 602 SE 14th Ct
- 1420 SE Elliott Ave
- 1317 SE Linden Ct
- 620 SE 14th Ct
- 1320 SE Elliott Ave
- 1314 SE Linden Ct
- 1502 SE Elliott Ave
- 625 SE 14th Ct
- 615 SE 14th Ct
- 524 SE 14th Ct
- 1314 SE Elliott Ave
- 523 SE 15th St
- 1329 SE Linden Ct
- 521 SE 14th Ct
- 506 SE 14th Ct
- 1302 SE Elliott Ave
- 1518 SE Elliott Ave
- 1311 SE Elliott Ave
- 520 SE 15th St
- 509 SE 14th Ct
Your Personal Tour Guide
Ask me questions while you tour the home.