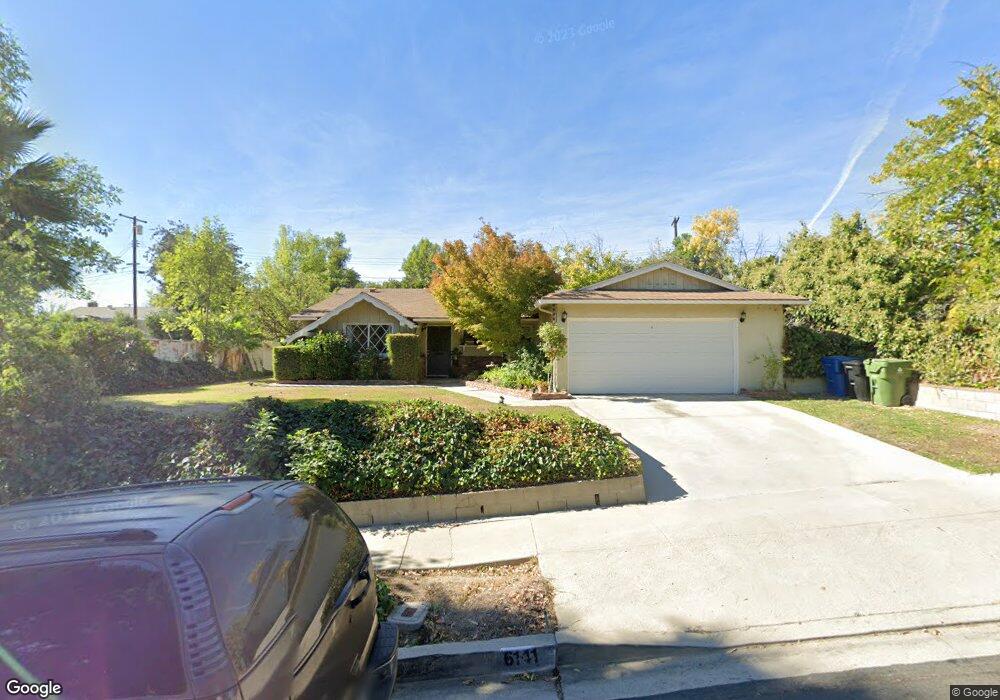
6141 Dalecrest Ave Woodland Hills, CA 91367
Estimated Value: $1,057,633 - $1,256,000
3
Beds
2
Baths
1,570
Sq Ft
$744/Sq Ft
Est. Value
About This Home
This home is located at 6141 Dalecrest Ave, Woodland Hills, CA 91367 and is currently estimated at $1,168,158, approximately $744 per square foot. 6141 Dalecrest Ave is a home located in Los Angeles County with nearby schools including Lockhurst Drive Charter Elementary, Woodlake Elementary Community Charter, and Haynes Charter For Enriched Studies.
Ownership History
Date
Name
Owned For
Owner Type
Purchase Details
Closed on
Jun 22, 2010
Sold by
Rosen Bruce
Bought by
Rosen Richard R
Current Estimated Value
Home Financials for this Owner
Home Financials are based on the most recent Mortgage that was taken out on this home.
Original Mortgage
$388,000
Outstanding Balance
$256,311
Interest Rate
4.68%
Mortgage Type
Seller Take Back
Estimated Equity
$911,847
Purchase Details
Closed on
Jun 17, 2010
Sold by
Rosen Richard A
Bought by
Kamar Dimitry and Kamar Ioanna
Home Financials for this Owner
Home Financials are based on the most recent Mortgage that was taken out on this home.
Original Mortgage
$388,000
Outstanding Balance
$256,311
Interest Rate
4.68%
Mortgage Type
Seller Take Back
Estimated Equity
$911,847
Purchase Details
Closed on
May 9, 2003
Sold by
Rosen Norma
Bought by
Rosen Norma and Rosen Richard A
Create a Home Valuation Report for This Property
The Home Valuation Report is an in-depth analysis detailing your home's value as well as a comparison with similar homes in the area
Home Values in the Area
Average Home Value in this Area
Purchase History
| Date | Buyer | Sale Price | Title Company |
|---|---|---|---|
| Rosen Richard R | -- | Progressive Title Company | |
| Kamar Dimitry | $485,000 | Progressive Title Company | |
| Rosen Norma | -- | Progressive Title |
Source: Public Records
Mortgage History
| Date | Status | Borrower | Loan Amount |
|---|---|---|---|
| Open | Kamar Dimitry | $388,000 |
Source: Public Records
Tax History Compared to Growth
Tax History
| Year | Tax Paid | Tax Assessment Tax Assessment Total Assessment is a certain percentage of the fair market value that is determined by local assessors to be the total taxable value of land and additions on the property. | Land | Improvement |
|---|---|---|---|---|
| 2025 | $7,674 | $621,356 | $457,629 | $163,727 |
| 2024 | $7,674 | $609,173 | $448,656 | $160,517 |
| 2023 | $7,529 | $597,229 | $439,859 | $157,370 |
| 2022 | $7,184 | $585,520 | $431,235 | $154,285 |
| 2021 | $7,094 | $574,040 | $422,780 | $151,260 |
| 2019 | $6,885 | $557,016 | $410,241 | $146,775 |
| 2018 | $6,804 | $546,096 | $402,198 | $143,898 |
| 2016 | $6,501 | $524,892 | $386,581 | $138,311 |
| 2015 | $6,408 | $517,009 | $380,775 | $136,234 |
| 2014 | $6,435 | $506,883 | $373,317 | $133,566 |
Source: Public Records
Map
Nearby Homes
- 6172 Dalecrest Ave
- 6227 Glide Ave
- 6001 Manton Ave
- 6236 Kenwater Ave
- 23812 Calvert St
- 23432 Victory Blvd
- 23367 Friar St
- 23549 Victory Blvd Unit 21
- 23416 Califa St
- 6416 Kenwater Place
- 5929 Adler Ave
- 23201 Oxnard St
- 23357 Hatteras St
- 23238 Victory Blvd
- 6153 Debs Ave
- 23123 Oxnard St
- 24017 Sylvan St
- 6022 Elba Place
- 23717 Crosson Dr
- 23853 Hatteras St
- 6131 Dalecrest Ave
- 6149 Dalecrest Ave
- 6136 Manton Ave
- 6128 Manton Ave
- 6142 Manton Ave
- 6121 Dalecrest Ave
- 6157 Dalecrest Ave
- 6120 Manton Ave
- 6136 Dalecrest Ave
- 6144 Dalecrest Ave
- 6150 Manton Ave
- 6128 Dalecrest Ave
- 6152 Dalecrest Ave
- 6120 Dalecrest Ave
- 6160 Dalecrest Ave
- 6135 Manton Ave
- 6141 Manton Ave
- 23544 Erwin St
- 6125 Manton Ave
- 23552 Erwin St