Estimated Value: $762,000 - $805,000
3
Beds
3
Baths
1,635
Sq Ft
$480/Sq Ft
Est. Value
About This Home
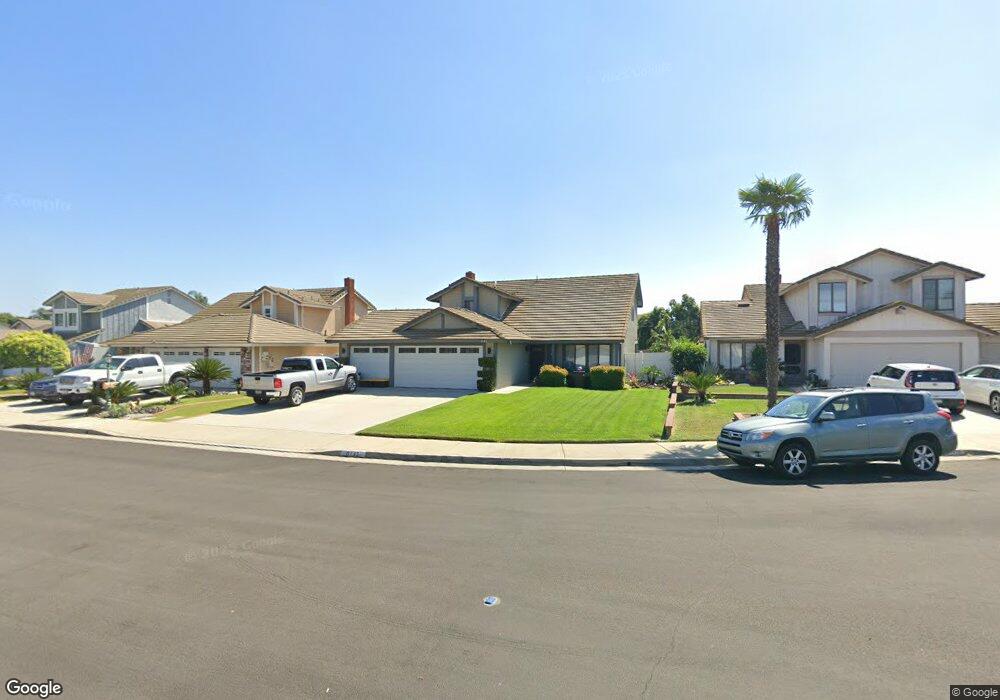
This home is located at 6143 Carter Ct, Chino, CA 91710 and is currently estimated at $784,599, approximately $479 per square foot. 6143 Carter Ct is a home located in San Bernardino County with nearby schools including Howard Cattle Elementary, Magnolia Junior High, and Chino High School.
Ownership History
Date
Name
Owned For
Owner Type
Purchase Details
Closed on
Nov 18, 2020
Sold by
Burns Dennis M
Bought by
Burns Dennis M
Current Estimated Value
Home Financials for this Owner
Home Financials are based on the most recent Mortgage that was taken out on this home.
Original Mortgage
$215,000
Outstanding Balance
$191,319
Interest Rate
2.8%
Mortgage Type
New Conventional
Estimated Equity
$593,280
Purchase Details
Closed on
Jul 15, 1997
Sold by
Burns Larraine M A
Bought by
Burns Dennis M
Purchase Details
Closed on
Sep 22, 1993
Sold by
Carroll John F and Carroll Marlyn J
Bought by
Burns Dennis M and Burns Larraine M A
Home Financials for this Owner
Home Financials are based on the most recent Mortgage that was taken out on this home.
Original Mortgage
$170,100
Interest Rate
6.81%
Create a Home Valuation Report for This Property
The Home Valuation Report is an in-depth analysis detailing your home's value as well as a comparison with similar homes in the area
Home Values in the Area
Average Home Value in this Area
Purchase History
| Date | Buyer | Sale Price | Title Company |
|---|---|---|---|
| Burns Dennis M | -- | Ticor Title | |
| Burns Dennis M | -- | -- | |
| Burns Dennis M | $189,000 | World Title Company |
Source: Public Records
Mortgage History
| Date | Status | Borrower | Loan Amount |
|---|---|---|---|
| Open | Burns Dennis M | $215,000 | |
| Closed | Burns Dennis M | $170,100 |
Source: Public Records
Tax History Compared to Growth
Tax History
| Year | Tax Paid | Tax Assessment Tax Assessment Total Assessment is a certain percentage of the fair market value that is determined by local assessors to be the total taxable value of land and additions on the property. | Land | Improvement |
|---|---|---|---|---|
| 2025 | $3,469 | $321,234 | $80,390 | $240,844 |
| 2024 | $3,469 | $314,936 | $78,814 | $236,122 |
| 2023 | $3,373 | $308,761 | $77,269 | $231,492 |
| 2022 | $3,352 | $302,707 | $75,754 | $226,953 |
| 2021 | $3,286 | $296,772 | $74,269 | $222,503 |
| 2020 | $3,244 | $293,729 | $73,507 | $220,222 |
| 2019 | $3,186 | $287,970 | $72,066 | $215,904 |
| 2018 | $3,116 | $282,324 | $70,653 | $211,671 |
| 2017 | $3,060 | $276,789 | $69,268 | $207,521 |
| 2016 | $2,861 | $271,362 | $67,910 | $203,452 |
| 2015 | $2,804 | $267,286 | $66,890 | $200,396 |
| 2014 | $2,748 | $262,051 | $65,580 | $196,471 |
Source: Public Records
Map
Nearby Homes
- 13555 Magnolia Ave
- 11610 Granville Place
- 13536 Sycamore Ln
- 13775 Harvard Ave
- 6594 Manzanita Ct
- 6169 Winona St
- 6212 Athena St
- 14134 Mountain Ave
- 5962 C St
- 6031 Rosa Ct
- 14212 Willamette Ave
- 13014 Bermuda Ave
- 6162 Davidson St
- 6147 Davidson St
- 12936 Cambridge Ct
- 6570 Encina St
- 14170 Durazno Ave
- 5925 Riverside Dr Unit 12
- 13022 Cypress Ave
- 6441 Susana St
- 6135 Carter Ct
- 6151 Carter Ct
- 6159 Carter Ct
- 6144 Ashley Ct
- 6127 Carter Ct
- 6136 Ashley Ct
- 6152 Ashley Ct
- 6160 Ashley Ct
- 6128 Ashley Ct
- 6167 Carter Ct
- 6142 Carter Ct
- 6150 Carter Ct
- 6134 Carter Ct
- 6168 Ashley Ct
- 6158 Carter Ct
- 13611 Magnolia Ave
- 6126 Carter Ct
- 6108 Schaefer Ave
- 6166 Carter Ct
- 6139 Yorkshire Rd