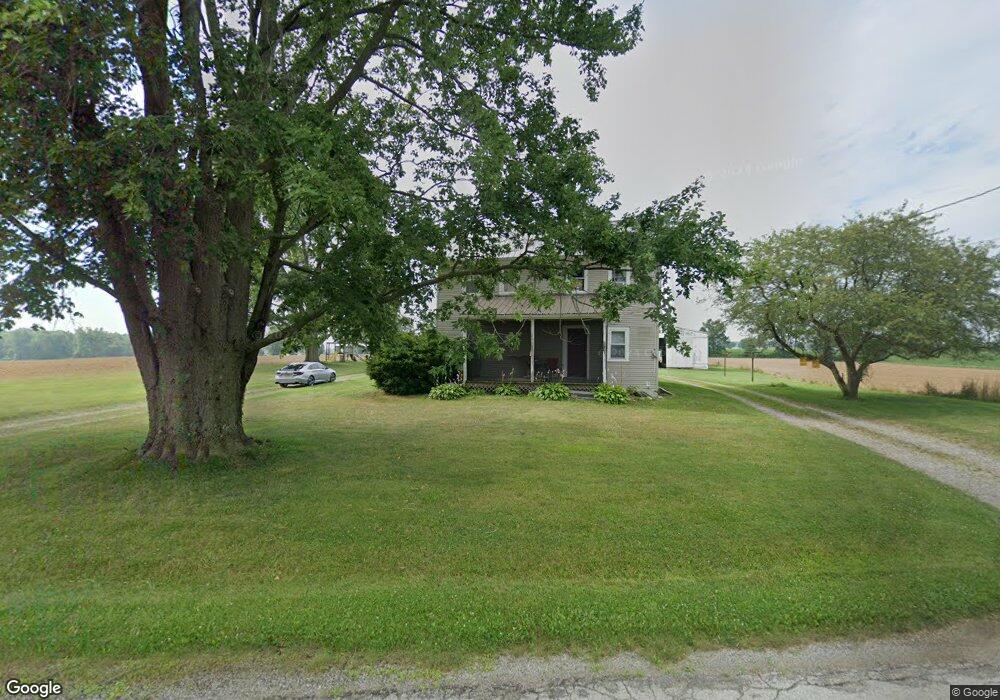
6146 Angling Rd Wooster, OH 44691
Estimated Value: $260,000
4
Beds
1
Bath
1,592
Sq Ft
$163/Sq Ft
Est. Value
About This Home
This home is located at 6146 Angling Rd, Wooster, OH 44691 and is currently estimated at $260,000, approximately $163 per square foot. 6146 Angling Rd is a home located in Wayne County with nearby schools including Northwestern Elementary School, Northwestern Middle School, and Northwestern High School.
Ownership History
Date
Name
Owned For
Owner Type
Purchase Details
Closed on
Aug 13, 2018
Sold by
Mykrantz Elsie S
Bought by
Mykrantz Elsie S and Elsie S Mykrantz Trust
Current Estimated Value
Purchase Details
Closed on
Jul 24, 2018
Sold by
Mykrantz Elsie S
Bought by
Mykrantz Elsie S and Mykrantz Family Trust Survivor S Trust A
Purchase Details
Closed on
May 27, 2016
Sold by
Mykrantz Thomas S & Elsie S Trustees
Bought by
Mykrantz Elsie S Trustee
Home Financials for this Owner
Home Financials are based on the most recent Mortgage that was taken out on this home.
Interest Rate
3.64%
Create a Home Valuation Report for This Property
The Home Valuation Report is an in-depth analysis detailing your home's value as well as a comparison with similar homes in the area
Home Values in the Area
Average Home Value in this Area
Purchase History
| Date | Buyer | Sale Price | Title Company |
|---|---|---|---|
| Mykrantz Elsie S | -- | None Available | |
| Mykrantz Elsie S | -- | None Available | |
| Mykrantz Elsie S Trustee | -- | -- |
Source: Public Records
Mortgage History
| Date | Status | Borrower | Loan Amount |
|---|---|---|---|
| Closed | Mykrantz Elsie S Trustee | -- |
Source: Public Records
Tax History Compared to Growth
Tax History
| Year | Tax Paid | Tax Assessment Tax Assessment Total Assessment is a certain percentage of the fair market value that is determined by local assessors to be the total taxable value of land and additions on the property. | Land | Improvement |
|---|---|---|---|---|
| 2024 | $1,273 | $64,640 | $49,540 | $15,100 |
| 2023 | $1,273 | $64,640 | $49,540 | $15,100 |
| 2022 | $1,132 | $64,640 | $49,540 | $15,100 |
| 2021 | $1,135 | $64,640 | $49,540 | $15,100 |
| 2020 | $1,170 | $65,190 | $49,540 | $15,650 |
| 2019 | $1,361 | $52,640 | $37,650 | $14,990 |
| 2018 | $1,332 | $52,640 | $37,650 | $14,990 |
| 2017 | $1,322 | $52,640 | $37,650 | $14,990 |
| 2016 | $1,482 | $42,640 | $27,650 | $14,990 |
| 2015 | $1,400 | $42,640 | $27,650 | $14,990 |
| 2014 | $1,412 | $42,640 | $27,650 | $14,990 |
| 2013 | $1,120 | $43,230 | $28,820 | $14,410 |
Source: Public Records
Map
Nearby Homes