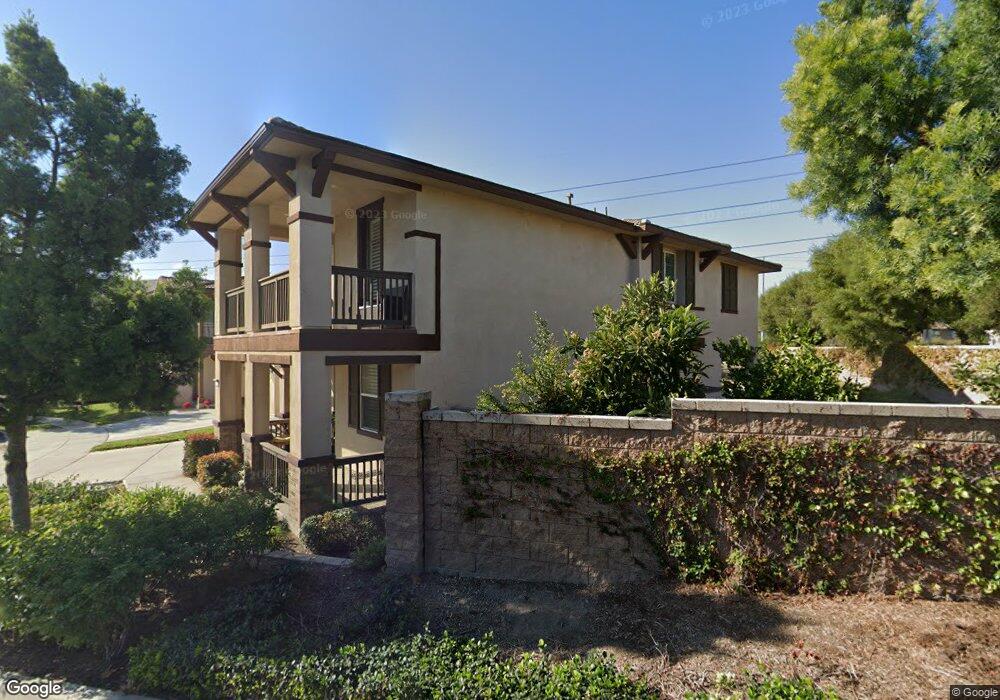
6148 Princeton St Chino, CA 91710
College Park NeighborhoodEstimated Value: $910,000 - $982,000
4
Beds
4
Baths
2,684
Sq Ft
$356/Sq Ft
Est. Value
About This Home
This home is located at 6148 Princeton St, Chino, CA 91710 and is currently estimated at $955,936, approximately $356 per square foot. 6148 Princeton St is a home with nearby schools including Edwin Rhodes Elementary, Magnolia Junior High, and Chino High School.
Ownership History
Date
Name
Owned For
Owner Type
Purchase Details
Closed on
Jul 27, 2024
Sold by
Ly Chan T and Ly Chan Tha
Bought by
Chan Ly Living Trust and Ly
Current Estimated Value
Purchase Details
Closed on
Aug 16, 2018
Sold by
Laxamana Danilo C
Bought by
Ly Chan T
Home Financials for this Owner
Home Financials are based on the most recent Mortgage that was taken out on this home.
Original Mortgage
$216,000
Interest Rate
4.5%
Mortgage Type
New Conventional
Purchase Details
Closed on
Jul 25, 2018
Sold by
Dee Yee Min
Bought by
Ly Chan T
Home Financials for this Owner
Home Financials are based on the most recent Mortgage that was taken out on this home.
Original Mortgage
$216,000
Interest Rate
4.5%
Mortgage Type
New Conventional
Purchase Details
Closed on
Jun 23, 2015
Sold by
Lennar Homes Of California Inc
Bought by
Dee Yee Min and Ly Linda
Home Financials for this Owner
Home Financials are based on the most recent Mortgage that was taken out on this home.
Original Mortgage
$277,000
Interest Rate
4.01%
Mortgage Type
New Conventional
Create a Home Valuation Report for This Property
The Home Valuation Report is an in-depth analysis detailing your home's value as well as a comparison with similar homes in the area
Home Values in the Area
Average Home Value in this Area
Purchase History
| Date | Buyer | Sale Price | Title Company |
|---|---|---|---|
| Chan Ly Living Trust | -- | None Listed On Document | |
| Ly Chan T | -- | Wfg National Title Company | |
| Ly Chan T | $360,000 | Wfg National Title Company | |
| Dee Yee Min | $555,000 | North American Title Co |
Source: Public Records
Mortgage History
| Date | Status | Borrower | Loan Amount |
|---|---|---|---|
| Previous Owner | Ly Chan T | $216,000 | |
| Previous Owner | Dee Yee Min | $277,000 |
Source: Public Records
Tax History Compared to Growth
Tax History
| Year | Tax Paid | Tax Assessment Tax Assessment Total Assessment is a certain percentage of the fair market value that is determined by local assessors to be the total taxable value of land and additions on the property. | Land | Improvement |
|---|---|---|---|---|
| 2025 | $10,364 | $641,424 | $223,104 | $418,320 |
| 2024 | $10,364 | $628,847 | $218,729 | $410,118 |
| 2023 | $10,172 | $616,516 | $214,440 | $402,076 |
| 2022 | $10,132 | $604,427 | $210,235 | $394,192 |
| 2021 | $10,001 | $592,576 | $206,113 | $386,463 |
| 2020 | $9,916 | $586,500 | $204,000 | $382,500 |
| 2019 | $9,802 | $575,000 | $200,000 | $375,000 |
| 2018 | $9,812 | $577,422 | $202,878 | $374,544 |
| 2017 | $9,698 | $566,100 | $198,900 | $367,200 |
| 2016 | $9,299 | $129,277 | $129,277 | $0 |
| 2015 | $2,603 | $127,335 | $127,335 | $0 |
| 2014 | -- | $34,697 | $34,697 | $0 |
Source: Public Records
Map
Nearby Homes
- 14654 Willamette Ave
- 6020 Grace St
- 14681 Marist Ln
- 14700 Marist Ln
- 6248 Desales St
- 6046 Lyon St
- 6147 Davidson St
- 6162 Davidson St
- 14212 Willamette Ave
- 6501 Wheaton St
- 6212 Athena St
- 14400 Belhaven Ave
- 6169 Winona St
- 14380 Belhaven Ave
- 6599 Eucalyptus Ave
- 14134 Mountain Ave
- 6611 Eucalyptus Ave
- 6641 Eucalyptus Ave
- 6656 Biola St
- 14170 Durazno Ave
- 14552 Willamette Ave
- 6162 Princeton St
- 14560 Willamette Ave
- 6167 Eucalyptus Ave
- 6163 Eucalyptus Ave
- 6179 Eucalyptus Ave
- 6170 Princeton St
- 14568 Willamette Ave
- 6161 Princeton St
- 6169 Princeton St
- 6178 Princeton St
- 6187 Eucalyptus Ave
- 14574 Willamette Ave
- 6160 Cumberland St
- 6175 Princeton St
- 6186 Princeton St
- 14582 Willamette Ave
- 6183 Princeton St
- 6197 Eucalyptus Ave
- 6174 Cumberland St