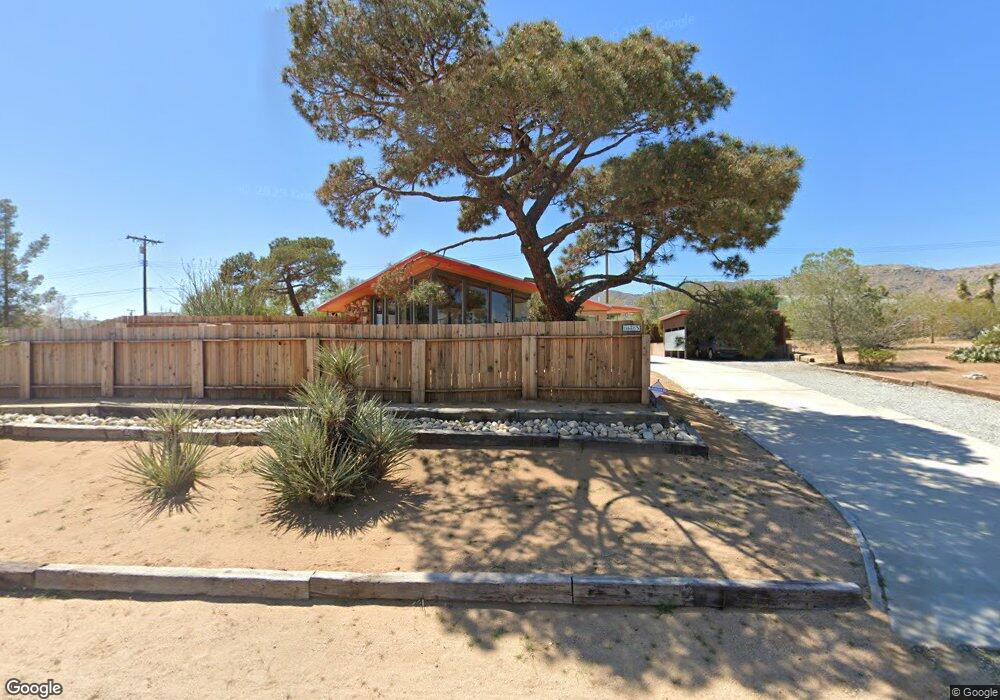
61485 Adobe Dr Joshua Tree, CA 92252
Estimated Value: $296,296 - $407,000
2
Beds
1
Bath
1,080
Sq Ft
$321/Sq Ft
Est. Value
About This Home
This home is located at 61485 Adobe Dr, Joshua Tree, CA 92252 and is currently estimated at $346,824, approximately $321 per square foot. 61485 Adobe Dr is a home located in San Bernardino County with nearby schools including Joshua Tree Elementary School, La Contenta Middle School, and Yucca Valley High School.
Ownership History
Date
Name
Owned For
Owner Type
Purchase Details
Closed on
Jan 6, 2026
Sold by
Dwyer James Robert
Bought by
Dwyer James Robert
Current Estimated Value
Home Financials for this Owner
Home Financials are based on the most recent Mortgage that was taken out on this home.
Original Mortgage
$125,000
Outstanding Balance
$124,881
Interest Rate
6.23%
Mortgage Type
New Conventional
Estimated Equity
$221,943
Purchase Details
Closed on
May 15, 2025
Sold by
William Brown Davenport Ii Living Trust and Dwyer James
Bought by
Dwyer James
Purchase Details
Closed on
Jan 6, 2014
Sold by
Davenport William B
Bought by
William Brown Davenport Ii Living Trust
Purchase Details
Closed on
Jul 13, 2006
Sold by
Davenport William B
Bought by
Davenport William B
Home Financials for this Owner
Home Financials are based on the most recent Mortgage that was taken out on this home.
Original Mortgage
$40,000
Interest Rate
6.76%
Mortgage Type
New Conventional
Purchase Details
Closed on
Jun 15, 1995
Sold by
Stewart Marty and Living Trust Of Marty Stewart
Bought by
Davenport William B
Home Financials for this Owner
Home Financials are based on the most recent Mortgage that was taken out on this home.
Original Mortgage
$58,000
Interest Rate
7.59%
Mortgage Type
Seller Take Back
Create a Home Valuation Report for This Property
The Home Valuation Report is an in-depth analysis detailing your home's value as well as a comparison with similar homes in the area
Home Values in the Area
Average Home Value in this Area
Purchase History
We collect this data history from publicly available records. To have your information removed, we recommend requesting removal directly through your county’s website.
| Date | Buyer | Sale Price | Title Company |
|---|---|---|---|
| Dwyer James Robert | -- | Stewart Title Of California | |
| Dwyer James | -- | None Listed On Document | |
| William Brown Davenport Ii Living Trust | -- | Accommodation | |
| Davenport William B | -- | Fidelity Natl Title Ins Co | |
| Davenport William B | $78,000 | First American Title Ins Co |
Source: Public Records
Mortgage History
We collect this data history from publicly available records. To have your information removed, we recommend requesting removal directly through your county’s website.
| Date | Status | Borrower | Loan Amount |
|---|---|---|---|
| Open | Dwyer James Robert | $125,000 | |
| Previous Owner | Davenport William B | $40,000 | |
| Previous Owner | Davenport William B | $58,000 |
Source: Public Records
Tax History
| Year | Tax Paid | Tax Assessment Tax Assessment Total Assessment is a certain percentage of the fair market value that is determined by local assessors to be the total taxable value of land and additions on the property. | Land | Improvement |
|---|---|---|---|---|
| 2025 | $1,584 | $113,797 | $24,919 | $88,878 |
| 2024 | $1,519 | $111,565 | $24,430 | $87,135 |
| 2023 | $1,489 | $109,377 | $23,951 | $85,426 |
| 2022 | $1,459 | $107,232 | $23,481 | $83,751 |
| 2021 | $1,440 | $105,130 | $23,021 | $82,109 |
| 2020 | $1,427 | $104,052 | $22,785 | $81,267 |
| 2019 | $1,499 | $102,012 | $22,338 | $79,674 |
| 2018 | $1,346 | $100,012 | $21,900 | $78,112 |
| 2017 | $1,332 | $98,051 | $21,471 | $76,580 |
| 2016 | $1,310 | $96,128 | $21,050 | $75,078 |
| 2015 | $1,244 | $94,684 | $20,734 | $73,950 |
| 2014 | $1,270 | $92,829 | $20,328 | $72,501 |
Source: Public Records
Map
Nearby Homes
- 61625 Alta Vista Dr
- 61381 Alta Mura Dr
- 7005 Hillview Rd
- 61619 Granada Dr
- 61503 Sunburst Dr
- 7276 Encina Rd
- 61664 Crest Circle Dr
- 6650 Hillview Rd
- 6896 Conejo Ave
- 1040 Sunset Rd
- 61611 Alta Loma Dr
- 2020 Sunset Rd
- 61424 Latham Trail
- 61582 Palm Vista Dr
- 61746 Crest Circle Dr
- 61537 Valley View Dr
- 61673 Palm Vista Dr
- 61774 Alta Vista Dr
- 61481 Latham Trail
- 61681 Palm Vista Dr
- 61488 Alta Vista Dr
- 61505 Adobe Dr
- 61457 Adobe Dr
- 61496 Alta Vista Dr
- 61464 Alta Vista Dr
- 61484 Adobe Dr
- 61494 Adobe Dr
- 61474 Adobe Dr
- 61506 Alta Vista Dr
- 61455 Adobe Dr
- 61515 Adobe Dr
- 61516 Adobe Dr
- 61489 Alta Vista Dr
- 61495 Crest Circle Dr
- 61495 Alta Vista Dr
- 61439 Adobe Dr
- 61473 Crest Circle Dr
- 61465 Alta Vista Dr
- 61505 Alta Vista Dr
- 61542 Adobe Dr
Your Personal Tour Guide
Ask me questions while you tour the home.