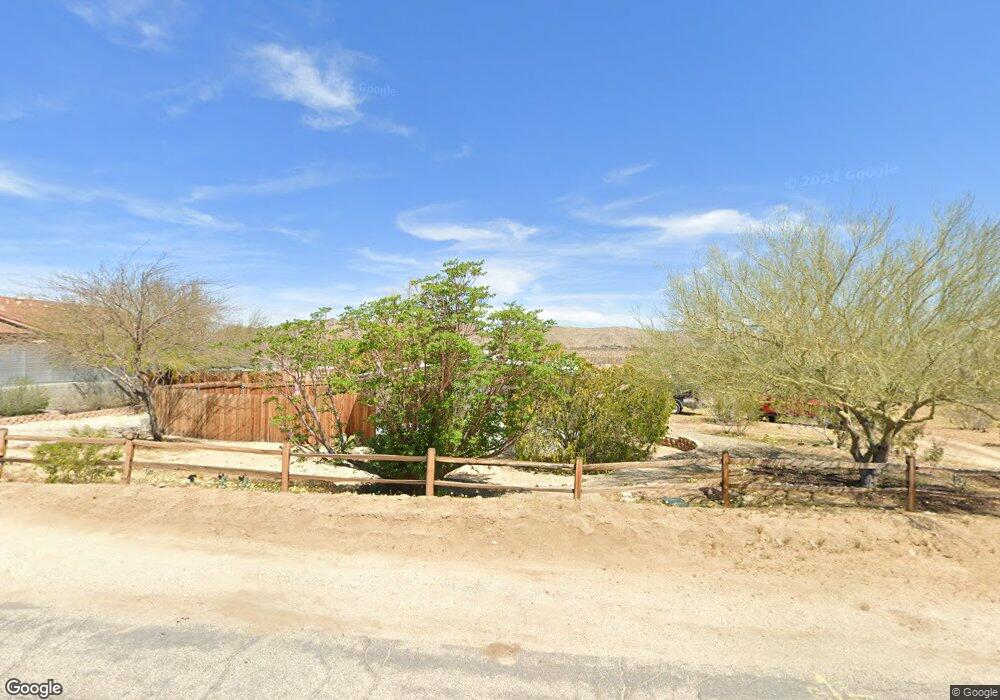
NOT LISTED FOR SALE

Estimated Value: $367,000 - $549,000

2 Beds
1 Bath
1,650 Sq Ft
$285/Sq Ft Est. Value

About This Home

This home is located at 61498 Desert Air Rd, Joshua Tree, CA 92252 and is currently estimated at $469,880, approximately $284 per square foot. 61498 Desert Air Rd is a home located in San Bernardino County with nearby schools including Joshua Tree Elementary School, La Contenta Middle School, and Yucca Valley High School.

Ownership History

Date Name Owned For Owner Type

Purchase Details

Closed on
Aug 4, 2011
Sold by
Arnold Thurman W
Bought by
Johnston Stephen Mark
Current Estimated Value
$469,880

Home Financials for this Owner

Home Financials are based on the most recent Mortgage that was taken out on this home.
Original Mortgage
$87,718
Interest Rate
4.01%
Mortgage Type
FHA

Purchase Details

Closed on
Jul 6, 2011
Sold by
Bowling Michelle
Bought by
Arnold Thurman W

Home Financials for this Owner

Home Financials are based on the most recent Mortgage that was taken out on this home.
Original Mortgage
$87,718
Interest Rate
4.01%
Mortgage Type
FHA

Purchase Details

Closed on
Oct 10, 2007
Sold by
Bowling Mark B
Bought by
Bowling Michelle L

Purchase Details

Closed on
May 8, 2001
Sold by
Dettman Jeanette B
Bought by
Bowling Mark B and Bowling Michelle L

Range of Values:

Collateral Analytics

Collateral Analytics Collateral Analytics AVMs (Automated Valuation Model) employ a number of statistical approaches combined with neighborhood-specific comparable selection guarantees the most up-to-date and precise valuations.

Not Available

Collateral Analytics does not have data for the current month. Please view the chart for historical values.

ICE

ICE Mortgage Technology ICE Mortgage Technology’s AVM (Automated Valuation Model) is a state-of-the-art online residential property valuation tool that provides a quick and accurate estimate of the value of almost any home in the U.S.

Not Available

ICE Mortgage Technology does not have data for the current month. Please view the chart for historical values.

First American

First American First American Data & Analytics’ next-generation AVM combines unrivaled data assets with a blended ensemble of valuation models to produce highly accurate, reliable valuations you can trust.

Not Available

First American does not have data for the current month. Please view the chart for historical values.

Quantarium

Quantarium Quantarium’s valuation service, repeatedly proven the industry’s most accurate and comprehensive, is supercharged with a self-learning and auto-tuning AI engine that continually becomes smarter and more accurate as it processes daily inputs from the industry’s leading RE data lake.

Not Available

Quantarium does not have data for the current month. Please view the chart for historical values.

Average Value
Not Available
List Price
Sold Price
Create a Home Valuation Report for This Property
The Home Valuation Report is an in-depth analysis detailing your home's value as well as a comparison with similar homes in the area

Home Values in the Area

Source: Public Records

Average Home Value in this Area


Source: Public Records

Purchase History

Date Buyer Sale Price Title Company
Johnston Stephen Mark $90,000 Fidelity National Title
Arnold Thurman W $79,828 Lawyers Title Company Mv
Bowling Michelle L -- None Available
Bowling Mark B $61,000 First American Title
Source: Public Records

Mortgage History

Date Status Borrower Loan Amount
Open Johnston Stephen Mark $175,000
Previous Owner Johnston Stephen Mark $87,718
Previous Owner Bowling Michelle $0
Source: Public Records

Tax History Compared to Growth

Source: Public Records

Tax History

Year Tax Paid Tax Assessment Tax Assessment Total Assessment is a certain percentage of the fair market value that is determined by local assessors to be the total taxable value of land and additions on the property. Land Improvement
2024 $1,330 $80,042 $12,313 $67,729
2023 $1,307 $78,473 $12,072 $66,401
2022 $1,284 $76,934 $11,835 $65,099
2021 $1,270 $75,426 $11,603 $63,823
2020 $1,259 $74,653 $11,484 $63,169
2019 $1,311 $73,189 $11,259 $61,930
2018 $1,143 $71,754 $11,038 $60,716
2017 $1,134 $70,347 $10,822 $59,525
2016 $1,118 $68,968 $10,610 $58,358
2015 $1,079 $67,932 $10,451 $57,481
2014 $1,110 $66,601 $10,246 $56,355
Source: Public Records

Map