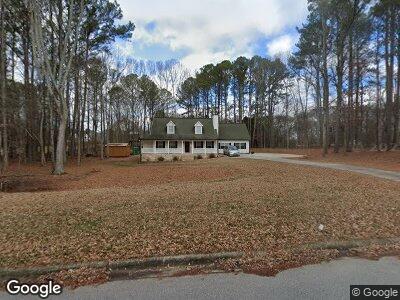
615 Davis Dr Bethlehem, GA 30620
Estimated Value: $331,000 - $464,000
--
Bed
2
Baths
1,989
Sq Ft
$187/Sq Ft
Est. Value
About This Home
This home is located at 615 Davis Dr, Bethlehem, GA 30620 and is currently estimated at $372,622, approximately $187 per square foot. 615 Davis Dr is a home located in Barrow County with nearby schools including Kennedy Elementary School, Westside Middle School, and Apalachee High School.
Ownership History
Date
Name
Owned For
Owner Type
Purchase Details
Closed on
Oct 31, 2014
Sold by
Snyder Bradley D
Bought by
Thomas Jason R and Thomas Ashley M
Current Estimated Value
Home Financials for this Owner
Home Financials are based on the most recent Mortgage that was taken out on this home.
Original Mortgage
$139,410
Interest Rate
4.26%
Mortgage Type
New Conventional
Purchase Details
Closed on
Dec 19, 1997
Sold by
Weed Thomas E and Weed Laurie M
Bought by
Snyder Bradley D and Snyder Rachel L
Home Financials for this Owner
Home Financials are based on the most recent Mortgage that was taken out on this home.
Original Mortgage
$126,800
Interest Rate
7.26%
Mortgage Type
New Conventional
Purchase Details
Closed on
Apr 5, 1996
Sold by
Rupard Robert
Bought by
Weid Thomas Laurie
Purchase Details
Closed on
Mar 2, 1994
Sold by
M & R Development In
Bought by
Rice & Rice Inc
Create a Home Valuation Report for This Property
The Home Valuation Report is an in-depth analysis detailing your home's value as well as a comparison with similar homes in the area
Home Values in the Area
Average Home Value in this Area
Purchase History
| Date | Buyer | Sale Price | Title Company |
|---|---|---|---|
| Thomas Jason R | $154,900 | -- | |
| Snyder Bradley D | $133,500 | -- | |
| Weid Thomas Laurie | $27,300 | -- | |
| Rupard Robert | $23,500 | -- | |
| Rice & Rice Inc | -- | -- |
Source: Public Records
Mortgage History
| Date | Status | Borrower | Loan Amount |
|---|---|---|---|
| Open | Thomas Jason R | $150,000 | |
| Closed | Thomas Jason R | $23,500 | |
| Closed | Thomas Jason R | $139,410 | |
| Previous Owner | Snyder Bradley D | $50,000 | |
| Previous Owner | Snyder Bradley D | $12,000 | |
| Previous Owner | Snyder Bradley D | $126,800 | |
| Closed | Rupard Robert | $0 |
Source: Public Records
Tax History Compared to Growth
Tax History
| Year | Tax Paid | Tax Assessment Tax Assessment Total Assessment is a certain percentage of the fair market value that is determined by local assessors to be the total taxable value of land and additions on the property. | Land | Improvement |
|---|---|---|---|---|
| 2024 | $2,386 | $94,456 | $23,002 | $71,454 |
| 2023 | $2,387 | $94,856 | $23,002 | $71,854 |
| 2022 | $2,200 | $74,976 | $23,002 | $51,974 |
| 2021 | $2,128 | $68,466 | $16,492 | $51,974 |
| 2020 | $2,133 | $68,466 | $16,492 | $51,974 |
| 2019 | $2,171 | $68,466 | $16,492 | $51,974 |
| 2018 | $2,073 | $66,010 | $16,492 | $49,518 |
| 2017 | $1,647 | $56,582 | $16,492 | $40,090 |
| 2016 | $1,699 | $54,004 | $16,492 | $37,512 |
| 2015 | $1,734 | $54,909 | $16,492 | $38,417 |
| 2014 | $1,378 | $46,950 | $8,081 | $38,869 |
| 2013 | -- | $44,540 | $8,081 | $36,458 |
Source: Public Records
Map
Nearby Homes
- 217 Richter Dr
- 0 Carson Wages Rd Unit 10348307
- 0 Monroe Hwy Unit 10466108
- 0 Monroe Hwy Unit 7530054
- 122 Sunningdale Dr
- 176 Market St
- 166 Market St
- 236 Vision St
- 842 Lodgeview Dr
- 00 Carson Wages Rd
- 69 E Wiseman Ln
- 338 Punkin Junction Rd
- 74 Gifton Thomas Rd
- 724 Manger Ave
- 233 Rydal Way
- 397 Harvey Lokey Rd
- 243 Rydal Way
- 683 Loganville Hwy
- 0 Manger Ave E Unit 20154677