J
Seller's Agent in 2016
Jennifer Robertson
The Realty Dot Inc
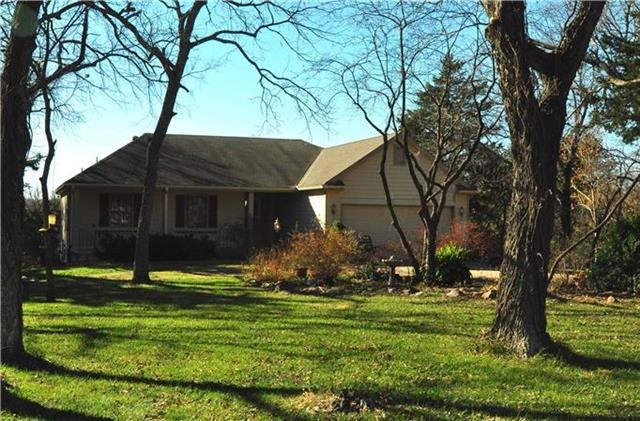

Estimated Value: $522,000 - $678,000
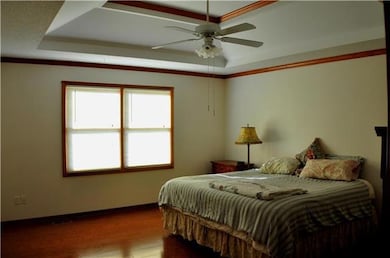
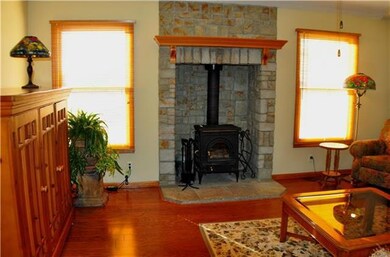
Upper level 1461 sq ft living space Honey Red Oak wood flooring Living room/foyer vaulted ceilings, catalytic wood stove, floor to ceiling stone wood stove surround, paddle fan Dining room tray ceiling, sliding glass doors to deck Kitchen - Maytag refrigerator, Bosch dishwasher, Maytag range/double oven, GE microwave Breakfast room Laundry room - Whirlpool washer, Kenmore dryer Master bedroom tray ceiling, paddle fan Master bath walk-in shower, walk-in closet 2 bedrooms
Last Agent to Sell the Property
Jennifer Robertson
The Realty Dot Inc License #BR00227296 Listed on: 11/27/2015
Last Buyer's Agent
Debbie Morgan
Stephens Real Estate License #BR00044436
| Date | Buyer | Sale Price | Title Company |
|---|---|---|---|
| Mcdonald Kelly | -- | None Available |
| Date | Status | Borrower | Loan Amount |
|---|---|---|---|
| Open | Mcdonald Kelly | $332,000 |
| Date | Event | Price | List to Sale | Price per Sq Ft |
|---|---|---|---|---|
| 06/15/2016 06/15/16 | Sold | -- | -- | -- |
| 03/16/2016 03/16/16 | Pending | -- | -- | -- |
| 11/27/2015 11/27/15 | For Sale | $439,000 | -- | $162 / Sq Ft |
| Year | Tax Paid | Tax Assessment Tax Assessment Total Assessment is a certain percentage of the fair market value that is determined by local assessors to be the total taxable value of land and additions on the property. | Land | Improvement |
|---|---|---|---|---|
| 2025 | $6,913 | $59,398 | $10,281 | $49,117 |
| 2024 | $6,887 | $58,903 | $9,936 | $48,967 |
| 2023 | $6,544 | $54,039 | $9,246 | $44,793 |
| 2022 | $6,199 | $49,427 | $7,866 | $41,561 |
| 2021 | $5,488 | $43,206 | $7,728 | $35,478 |
| 2020 | $5,336 | $41,876 | $7,728 | $34,148 |
| 2019 | $5,088 | $39,882 | $7,452 | $32,430 |
| 2018 | $5,012 | $39,078 | $7,372 | $31,706 |
| 2017 | $5,105 | $38,744 | $7,372 | $31,372 |
| 2016 | $5,114 | $39,331 | $7,590 | $31,741 |
| 2015 | $4,459 | $34,191 | $7,590 | $26,601 |
| 2014 | $4,386 | $33,631 | $7,590 | $26,041 |
J
Seller's Agent in 2016
Jennifer Robertson
The Realty Dot Inc
D
Buyer's Agent in 2016
Debbie Morgan
Stephens Real Estate
Source: Heartland MLS
MLS Number: 1967570
APN: 023-164-17-0-00-05-017.00-0
Disclaimer: Certain information contained herein is derived from information provided by parties other than Homes.com. All information provided is deemed reliable, but is not guaranteed to be accurate and should be independently verified.
![]() Based on information submitted to the MLS Grid. All data is obtained from various sources and may not have been verified by broker or MLS GRID. Supplied Open House Information is subject to change without notice. All information should be independently reviewed and verified for accuracy. Properties may or may not be listed by the office/agent presenting the information. Some IDX listings have been excluded from this website. Prices displayed on all Sold listings are the Last Known Listing Price and may not be the actual selling price.
Based on information submitted to the MLS Grid. All data is obtained from various sources and may not have been verified by broker or MLS GRID. Supplied Open House Information is subject to change without notice. All information should be independently reviewed and verified for accuracy. Properties may or may not be listed by the office/agent presenting the information. Some IDX listings have been excluded from this website. Prices displayed on all Sold listings are the Last Known Listing Price and may not be the actual selling price.
Listing Information presented by local MLS brokerage: TEN-X, INC., local REALTOR®- Arlene Richardson - (888) 952-6393
Based on information submitted to the MLS GRID.
Ask me questions while you tour the home.
