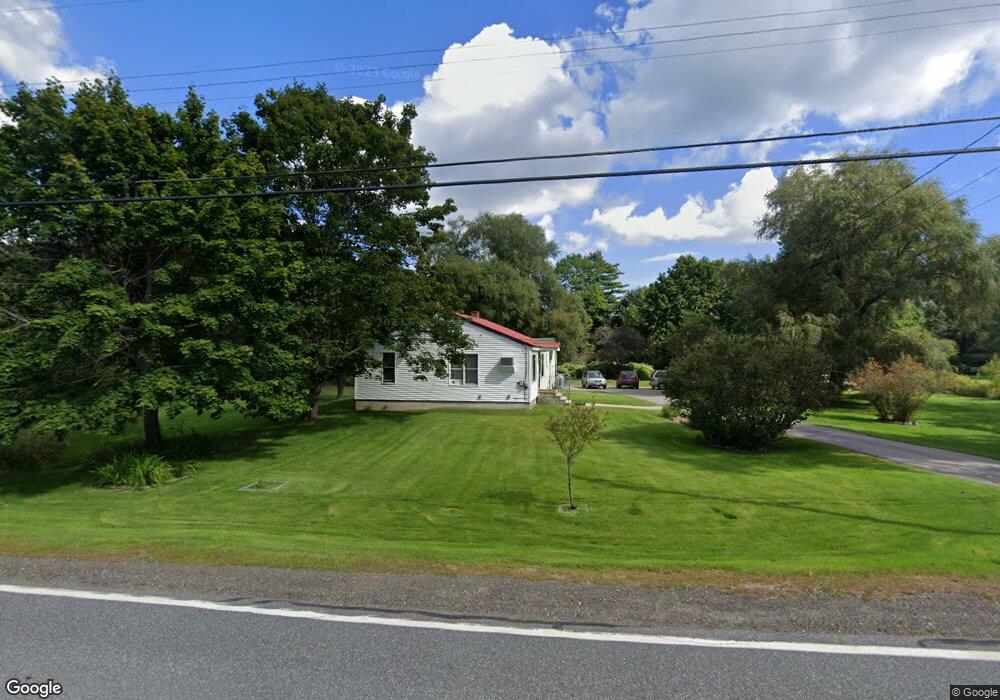
615 E Main St Yarmouth, ME 04096
Estimated Value: $437,000 - $596,000
2
Beds
1
Bath
1,080
Sq Ft
$484/Sq Ft
Est. Value
About This Home
This home is located at 615 E Main St, Yarmouth, ME 04096 and is currently estimated at $522,320, approximately $483 per square foot. 615 E Main St is a home located in Cumberland County with nearby schools including William H. Rowe School, Yarmouth Elementary School, and Frank H. Harrison Middle School.
Ownership History
Date
Name
Owned For
Owner Type
Purchase Details
Closed on
Jan 24, 2011
Sold by
Moran Tamara L and Usa Irs
Bought by
Renaissance Equity Loan and Hsbc Bank Usa Na
Current Estimated Value
Purchase Details
Closed on
Jan 30, 2008
Sold by
Moran Carl and Moran Tamara
Bought by
Moran Carl and Moran Tamara
Purchase Details
Closed on
Jun 5, 2007
Sold by
Bracy Marion L
Bought by
Moran Carl T and Moran Tamara L
Home Financials for this Owner
Home Financials are based on the most recent Mortgage that was taken out on this home.
Original Mortgage
$143,500
Interest Rate
11.39%
Mortgage Type
Unknown
Create a Home Valuation Report for This Property
The Home Valuation Report is an in-depth analysis detailing your home's value as well as a comparison with similar homes in the area
Home Values in the Area
Average Home Value in this Area
Purchase History
| Date | Buyer | Sale Price | Title Company |
|---|---|---|---|
| Renaissance Equity Loan | -- | -- | |
| Moran Carl | -- | -- | |
| Moran Carl T | -- | -- |
Source: Public Records
Mortgage History
| Date | Status | Borrower | Loan Amount |
|---|---|---|---|
| Previous Owner | Moran Carl T | $143,500 |
Source: Public Records
Tax History Compared to Growth
Tax History
| Year | Tax Paid | Tax Assessment Tax Assessment Total Assessment is a certain percentage of the fair market value that is determined by local assessors to be the total taxable value of land and additions on the property. | Land | Improvement |
|---|---|---|---|---|
| 2024 | $6,500 | $253,200 | $126,800 | $126,400 |
| 2023 | $5,960 | $253,200 | $126,800 | $126,400 |
| 2022 | $5,474 | $253,200 | $126,800 | $126,400 |
| 2021 | $5,013 | $253,200 | $126,800 | $126,400 |
| 2020 | $4,963 | $253,200 | $126,800 | $126,400 |
| 2019 | $4,775 | $253,200 | $126,800 | $126,400 |
| 2018 | $4,507 | $253,200 | $126,800 | $126,400 |
| 2017 | $4,345 | $253,200 | $126,800 | $126,400 |
| 2016 | $4,320 | $253,200 | $126,800 | $126,400 |
| 2015 | $3,874 | $179,700 | $97,600 | $82,100 |
| 2014 | $3,882 | $179,700 | $97,600 | $82,100 |
| 2013 | $3,953 | $179,700 | $0 | $0 |
Source: Public Records
Map
Nearby Homes
- 241 Bluff Rd Unit 4
- 203 Bluff Rd Unit 13
- 393 E Main St
- 0 Bayview St
- 119 Burnell Dr
- 149 E Main St Unit 7
- 69 Gail Ln
- 44 Ellen Cir
- 15 Sequoia Dr
- 583 North Rd
- 31 Sequoia Dr
- 247 Ledge Rd
- 62 Blueberry Cove Rd Unit 62
- 30 Blueberry Cove
- 52 Blueberry Cove Rd Unit 52
- 70 Main St
- 531 Ledge Rd
- 309 Main St Unit A
- 1 Railroad Square Unit Townhome C
- 1 Railroad Square Unit 103