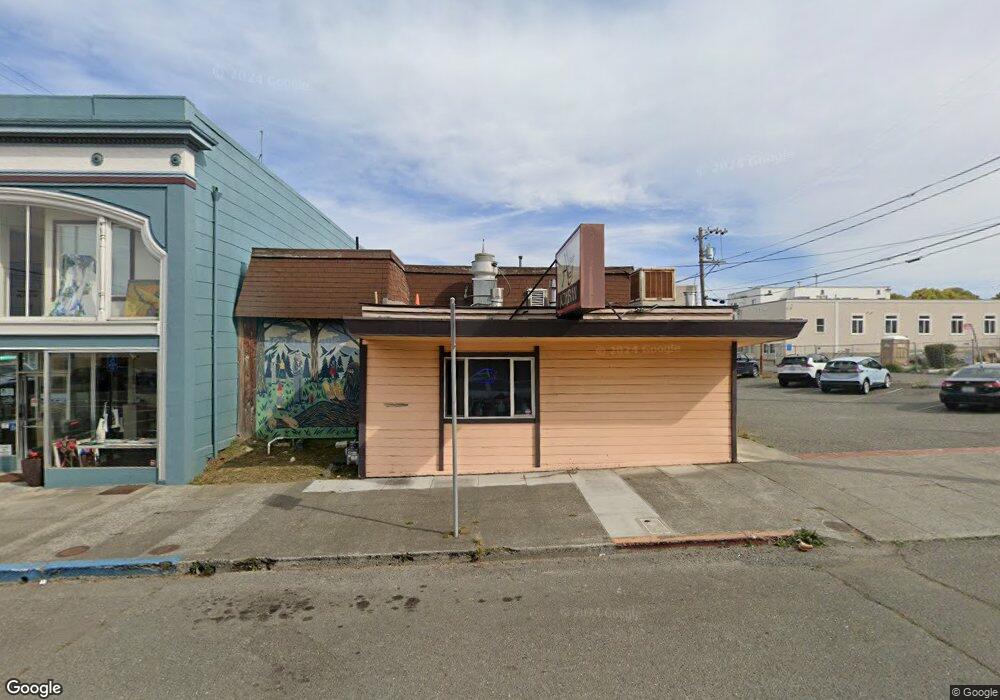
615 F St Eureka, CA 95501
Studio
--
Bath
2,077
Sq Ft
10,019
Sq Ft
About This Home
This home is located at 615 F St, Eureka, CA 95501. 615 F St is a home located in Humboldt County with nearby schools including Lafayette Elementary School, Catherine L. Zane Middle School, and Eureka Senior High School.
Ownership History
Date
Name
Owned For
Owner Type
Purchase Details
Closed on
Oct 1, 2021
Sold by
Robert J Frazier and Glenn And Shelle Goldan 2019 Trust
Bought by
Hale Yangkey Llc
Purchase Details
Closed on
Jul 27, 2021
Sold by
2003 Glenn G Goldan Trust and Goldan Glenn G
Bought by
Glenn And Shelle Goldan 2019 Trust and Goldan
Purchase Details
Closed on
Oct 4, 2019
Sold by
2003 Glenn G Goldan Trust
Bought by
T Glenn and Shelle T
Purchase Details
Closed on
Oct 24, 2013
Sold by
Goldan Glenn G
Bought by
Goldan Glenn G
Purchase Details
Closed on
Jul 31, 2013
Sold by
Goldan Glenn G
Bought by
Goldan Glenn G
Purchase Details
Closed on
Jan 6, 2012
Sold by
Frazier Robert J and Frazier Debra J
Bought by
Frazier Robert J and Frazier Debra J
Purchase Details
Closed on
Nov 19, 1998
Sold by
Zwielfelhofer Brenda C and Daly Cornelius D
Bought by
Frazier Robert J and Frazier Debra J
Create a Home Valuation Report for This Property
The Home Valuation Report is an in-depth analysis detailing your home's value as well as a comparison with similar homes in the area
Purchase History
| Date | Buyer | Sale Price | Title Company |
|---|---|---|---|
| Hale Yangkey Llc | $893,000 | Humboldt Land Title | |
| Glenn And Shelle Goldan 2019 Trust | -- | Humboldt Land Title | |
| T Glenn | -- | None Listed On Document | |
| Goldan Glenn G | -- | None Available | |
| Goldan Glenn G | -- | None Available | |
| Frazier Robert J | -- | None Available | |
| Frazier Robert J | -- | None Available | |
| Frazier Robert J | -- | -- |
Source: Public Records
Tax History
| Year | Tax Paid | Tax Assessment Tax Assessment Total Assessment is a certain percentage of the fair market value that is determined by local assessors to be the total taxable value of land and additions on the property. | Land | Improvement |
|---|---|---|---|---|
| 2025 | $3,940 | $383,094 | $233,465 | $149,629 |
| 2024 | $3,940 | $375,584 | $228,888 | $146,696 |
| 2023 | $3,885 | $368,220 | $224,400 | $143,820 |
| 2022 | $2,563 | $229,491 | $150,833 | $78,658 |
| 2021 | $2,401 | $224,992 | $147,876 | $77,116 |
| 2020 | $2,383 | $222,686 | $146,360 | $76,326 |
| 2019 | $2,334 | $218,321 | $143,491 | $74,830 |
| 2018 | $2,299 | $214,041 | $140,678 | $73,363 |
| 2017 | $2,287 | $209,845 | $137,920 | $71,925 |
| 2016 | $2,288 | $205,731 | $135,216 | $70,515 |
| 2015 | $2,268 | $202,641 | $133,185 | $69,456 |
| 2014 | $2,120 | $198,673 | $130,577 | $68,096 |
Source: Public Records
Map
Nearby Homes
Your Personal Tour Guide
Ask me questions while you tour the home.