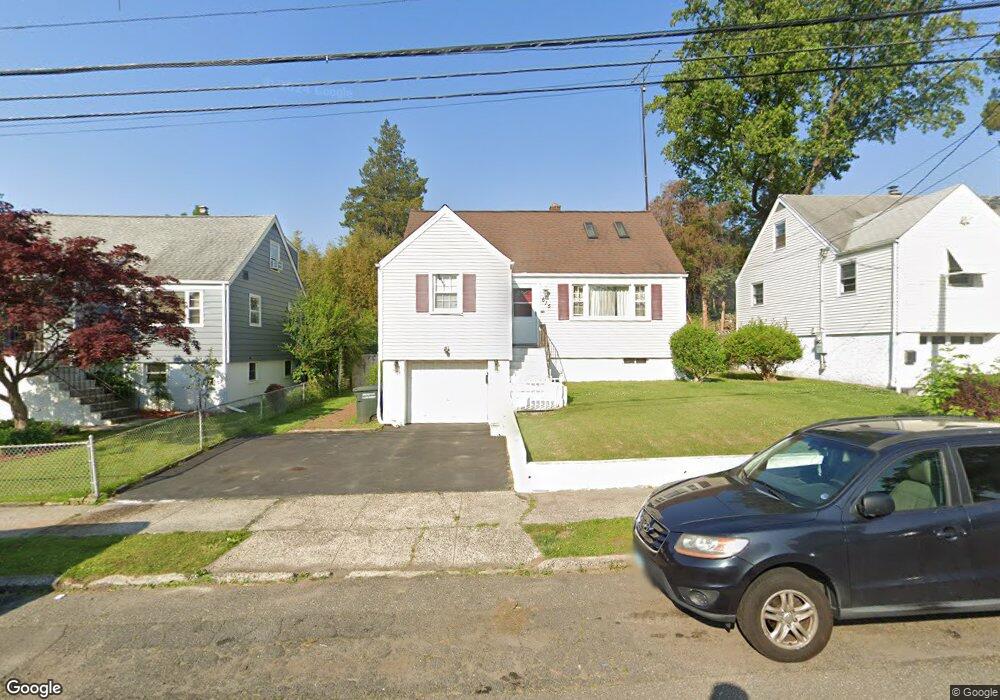
615 Hart St Bridgeport, CT 06606
North End NeighborhoodEstimated Value: $311,000 - $404,912
4
Beds
2
Baths
1,248
Sq Ft
$279/Sq Ft
Est. Value
About This Home
This home is located at 615 Hart St, Bridgeport, CT 06606 and is currently estimated at $347,978, approximately $278 per square foot. 615 Hart St is a home located in Fairfield County with nearby schools including Blackham School, Central High School, and Northeastern Adventist Academy - Fairfield County.
Ownership History
Date
Name
Owned For
Owner Type
Purchase Details
Closed on
Oct 30, 1998
Sold by
Devilla-Gonzalez A and Gonzalez Juan
Bought by
Moore Debra M
Current Estimated Value
Home Financials for this Owner
Home Financials are based on the most recent Mortgage that was taken out on this home.
Original Mortgage
$79,700
Interest Rate
6.68%
Create a Home Valuation Report for This Property
The Home Valuation Report is an in-depth analysis detailing your home's value as well as a comparison with similar homes in the area
Home Values in the Area
Average Home Value in this Area
Purchase History
| Date | Buyer | Sale Price | Title Company |
|---|---|---|---|
| Moore Debra M | $82,000 | -- | |
| Moore Debra M | $82,000 | -- |
Source: Public Records
Mortgage History
| Date | Status | Borrower | Loan Amount |
|---|---|---|---|
| Open | Moore Debra M | $150,000 | |
| Closed | Moore Debra M | $79,700 | |
| Previous Owner | Moore Debra M | $55,000 | |
| Closed | Moore Debra M | $6,100 |
Source: Public Records
Tax History Compared to Growth
Tax History
| Year | Tax Paid | Tax Assessment Tax Assessment Total Assessment is a certain percentage of the fair market value that is determined by local assessors to be the total taxable value of land and additions on the property. | Land | Improvement |
|---|---|---|---|---|
| 2025 | $6,721 | $154,680 | $70,340 | $84,340 |
| 2024 | $6,721 | $154,680 | $70,340 | $84,340 |
| 2023 | $6,721 | $154,680 | $70,340 | $84,340 |
| 2022 | $6,721 | $154,680 | $70,340 | $84,340 |
| 2021 | $6,721 | $154,680 | $70,340 | $84,340 |
| 2020 | $5,868 | $108,690 | $42,620 | $66,070 |
| 2019 | $5,868 | $108,690 | $42,620 | $66,070 |
| 2018 | $5,909 | $108,690 | $42,620 | $66,070 |
| 2017 | $5,909 | $108,690 | $42,620 | $66,070 |
| 2016 | $5,909 | $108,690 | $42,620 | $66,070 |
| 2015 | $5,460 | $129,380 | $42,970 | $86,410 |
| 2014 | $5,460 | $129,380 | $42,970 | $86,410 |
Source: Public Records
Map
Nearby Homes
- 1265 Lindley St
- 926 Hart St
- 916 Hart St
- 45 Stevens St Unit 2
- 138 Infield St
- 39 Infield St
- 330 Oakwood St
- 123 Exeter St
- 936 Lindley St
- 355 Chamberlain Ave
- 355 Exeter St
- 213 Exeter St
- 219 Exeter St
- 385 Chamberlain Ave
- 3401 Main St
- 354 Beechmont Ave
- 245 Indian Ave
- 235 Indian Ave
- 25 Broadway
- 113 Clark St