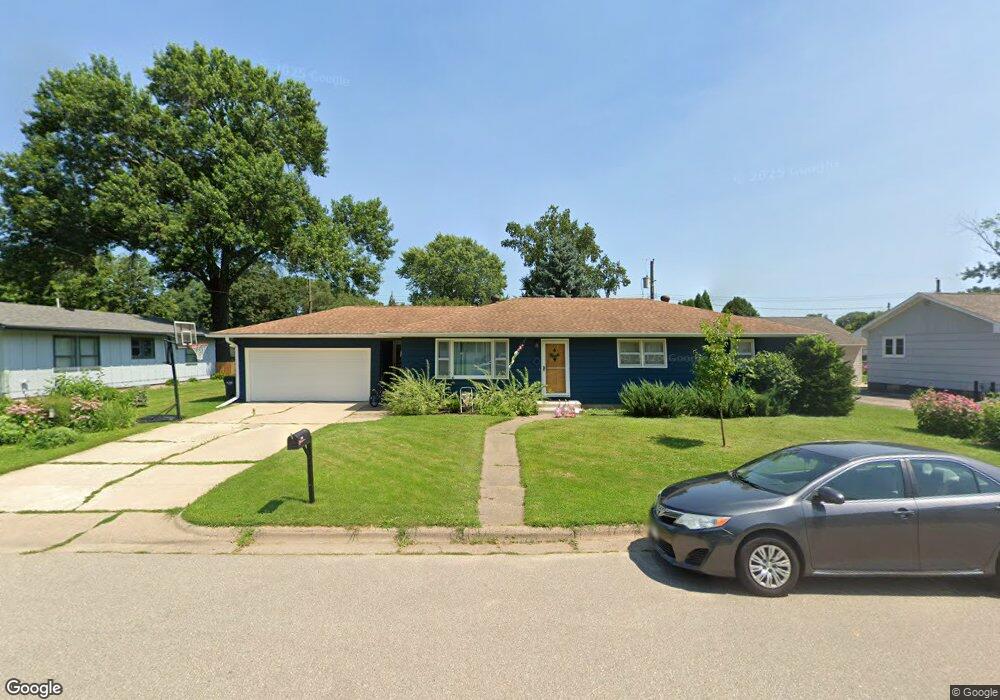
615 Larch Ave La Crescent, MN 55947
Estimated Value: $305,000 - $310,000
4
Beds
2
Baths
1,408
Sq Ft
$219/Sq Ft
Est. Value
About This Home
This home is located at 615 Larch Ave, La Crescent, MN 55947 and is currently estimated at $308,390, approximately $219 per square foot. 615 Larch Ave is a home located in Houston County with nearby schools including La Crescent-Hokah Elementary School, La Crescent-Hokah Middle School, and La Crescent-Hokah High School.
Ownership History
Date
Name
Owned For
Owner Type
Purchase Details
Closed on
Aug 2, 2021
Sold by
Johnson T
Bought by
Dawson Joseph J
Current Estimated Value
Home Financials for this Owner
Home Financials are based on the most recent Mortgage that was taken out on this home.
Original Mortgage
$18,800
Outstanding Balance
$17,121
Interest Rate
3%
Mortgage Type
Purchase Money Mortgage
Estimated Equity
$291,269
Purchase Details
Closed on
Jul 10, 2009
Sold by
Johnson Gladys H and Kendhammer Sharon L
Bought by
Johnson Gladys H and Kendhammer Sharon L
Create a Home Valuation Report for This Property
The Home Valuation Report is an in-depth analysis detailing your home's value as well as a comparison with similar homes in the area
Home Values in the Area
Average Home Value in this Area
Purchase History
We collect this data history from publicly available records. To have your information removed, we recommend requesting removal directly through your county’s website.
| Date | Buyer | Sale Price | Title Company |
|---|---|---|---|
| Dawson Joseph J | $262,000 | None Available | |
| Johnson Gladys H | -- | None Available | |
| Dawson Joseph Joseph | $262,000 | -- |
Source: Public Records
Mortgage History
We collect this data history from publicly available records. To have your information removed, we recommend requesting removal directly through your county’s website.
| Date | Status | Borrower | Loan Amount |
|---|---|---|---|
| Open | Dawson Joseph J | $18,800 | |
| Closed | Dawson Joseph Joseph | $261,000 |
Source: Public Records
Tax History
| Year | Tax Paid | Tax Assessment Tax Assessment Total Assessment is a certain percentage of the fair market value that is determined by local assessors to be the total taxable value of land and additions on the property. | Land | Improvement |
|---|---|---|---|---|
| 2025 | $3,636 | $292,700 | $55,000 | $237,700 |
| 2024 | $3,746 | $267,400 | $55,000 | $212,400 |
| 2023 | $3,734 | $258,200 | $38,100 | $220,100 |
| 2022 | $3,200 | $258,200 | $38,100 | $220,100 |
| 2021 | $3,178 | $194,300 | $38,100 | $156,200 |
| 2020 | $3,256 | $194,300 | $38,100 | $156,200 |
| 2019 | $1,422 | $197,800 | $38,100 | $159,700 |
| 2018 | $2,684 | $177,800 | $38,100 | $139,700 |
| 2017 | $2,684 | $149,800 | $35,529 | $114,271 |
| 2016 | $2,374 | $171,600 | $40,700 | $130,900 |
| 2015 | $2,236 | $162,500 | $38,500 | $124,000 |
| 2014 | $2,236 | $139,900 | $33,146 | $106,754 |
Source: Public Records
Map
Nearby Homes
- 604 Hickory Ct
- 1211 County 6 -
- 709 Wildwood Ct
- 524 S 2nd St
- 1367 County 25
- 517 N 3rd St
- 0 Hickory Ln
- 307 N Walnut St
- 426 Fireside Dr
- TBD County 6
- 421 Walnut Place
- 510 Mcintosh Rd
- 726 N 4th St
- 203 Eagles Bluff Rd
- 32765 County Road 1
- 329 River Point
- Tbd County Road 1
- 300 2nd St S
- 1608 Caroline St
- 411 3rd St S
Your Personal Tour Guide
Ask me questions while you tour the home.