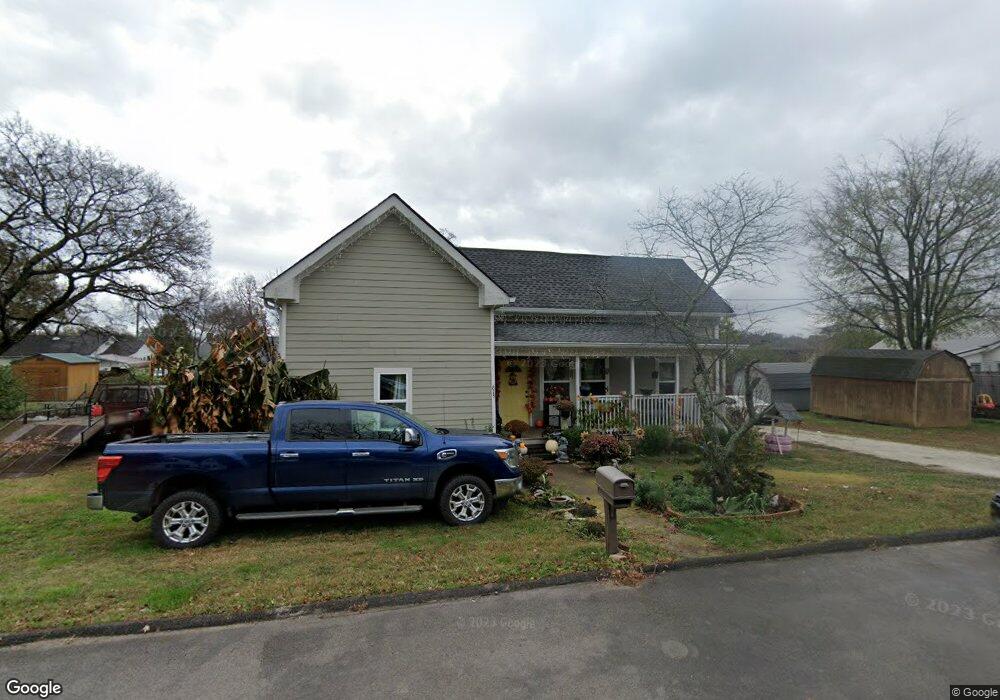
615 Limestone Ave Lewisburg, TN 37091
Estimated Value: $118,000 - $241,000
--
Bed
1
Bath
1,360
Sq Ft
$132/Sq Ft
Est. Value
About This Home
This home is located at 615 Limestone Ave, Lewisburg, TN 37091 and is currently estimated at $179,469, approximately $131 per square foot. 615 Limestone Ave is a home located in Marshall County with nearby schools including Marshall Elementary School, Oak Grove Elementary School, and Westhills Elementary School.
Ownership History
Date
Name
Owned For
Owner Type
Purchase Details
Closed on
Aug 13, 2024
Sold by
Rios Yesenia Isabel
Bought by
Munoz Carmona Jaqueline and Christian Munoz Christian
Current Estimated Value
Home Financials for this Owner
Home Financials are based on the most recent Mortgage that was taken out on this home.
Original Mortgage
$255,290
Outstanding Balance
$252,445
Interest Rate
6.95%
Mortgage Type
FHA
Estimated Equity
-$72,976
Purchase Details
Closed on
Dec 1, 2017
Sold by
Perryman Investments Llc
Bought by
Rios Yesenia Isabel
Purchase Details
Closed on
Oct 25, 2017
Sold by
Kyle Barbaralee
Bought by
Perryman Investments Llc
Purchase Details
Closed on
Oct 28, 2015
Sold by
Gonzalez-Leblan Janet M
Bought by
Kyle Barbaralee
Purchase Details
Closed on
Oct 19, 1989
Bought by
Tichenor Percy E and Tichenor Eloise M
Purchase Details
Closed on
Aug 9, 1986
Bought by
Baun Donald S and Baun Shelia Ann
Create a Home Valuation Report for This Property
The Home Valuation Report is an in-depth analysis detailing your home's value as well as a comparison with similar homes in the area
Home Values in the Area
Average Home Value in this Area
Purchase History
| Date | Buyer | Sale Price | Title Company |
|---|---|---|---|
| Munoz Carmona Jaqueline | $260,000 | Bell & Alexander Title | |
| Rios Yesenia Isabel | $40,000 | -- | |
| Perryman Investments Llc | $30,500 | -- | |
| Kyle Barbaralee | $200,000 | -- | |
| Tichenor Percy E | $5,000 | -- | |
| Baun Donald S | $10,000 | -- |
Source: Public Records
Mortgage History
| Date | Status | Borrower | Loan Amount |
|---|---|---|---|
| Open | Munoz Carmona Jaqueline | $255,290 |
Source: Public Records
Tax History Compared to Growth
Tax History
| Year | Tax Paid | Tax Assessment Tax Assessment Total Assessment is a certain percentage of the fair market value that is determined by local assessors to be the total taxable value of land and additions on the property. | Land | Improvement |
|---|---|---|---|---|
| 2024 | -- | $27,275 | $4,375 | $22,900 |
| 2023 | $847 | $27,275 | $4,375 | $22,900 |
| 2022 | $847 | $27,275 | $4,375 | $22,900 |
| 2021 | $561 | $12,050 | $2,200 | $9,850 |
| 2020 | $561 | $12,050 | $2,200 | $9,850 |
| 2019 | $543 | $12,050 | $2,200 | $9,850 |
| 2018 | $537 | $12,050 | $2,200 | $9,850 |
| 2017 | $537 | $12,050 | $2,200 | $9,850 |
| 2016 | $498 | $9,725 | $2,000 | $7,725 |
| 2015 | $454 | $9,725 | $2,000 | $7,725 |
| 2014 | $454 | $9,725 | $2,000 | $7,725 |
Source: Public Records
Map
Nearby Homes
- 594 5th Ave N
- 638 2nd Ave N
- 319 Greenwood St
- 231 Greenwood St
- 627 6th Ave N
- 543 2nd Ave N
- 630 6th Ave N
- 316 Haynes St
- 0 New Lake Rd Unit RTC3030964
- 726 Thomas Ave
- 416 1st Ave N
- 1600 Larry Dospil Dr
- 215 5th Ave N
- 319 E Hill Ave
- 518 Maple St
- 525 Maple St
- 610 Forrest St
- 1025 Glenn Ave
- 1144 Apple St
- 1111 W End Ave N
- 623 Limestone Ave
- 603 Limestone Ave
- 618 4th Ave N
- 610 4th Ave N
- 612 Limestone Ave
- 618 Limestone Ave
- 624 4th Ave N
- 602 4th Ave N
- 604 Limestone Ave
- 624 Limestone Ave
- 628 4th Ave N
- 576 4th Ave N
- 634 4th Ave N
- 584 Limestone Ave
- 639 Limestone Ave
- 632 Limestone Ave
- 623 4th Ave N
- 605 4th Ave N
- 613 5th Ave N
- 613 4th Ave N