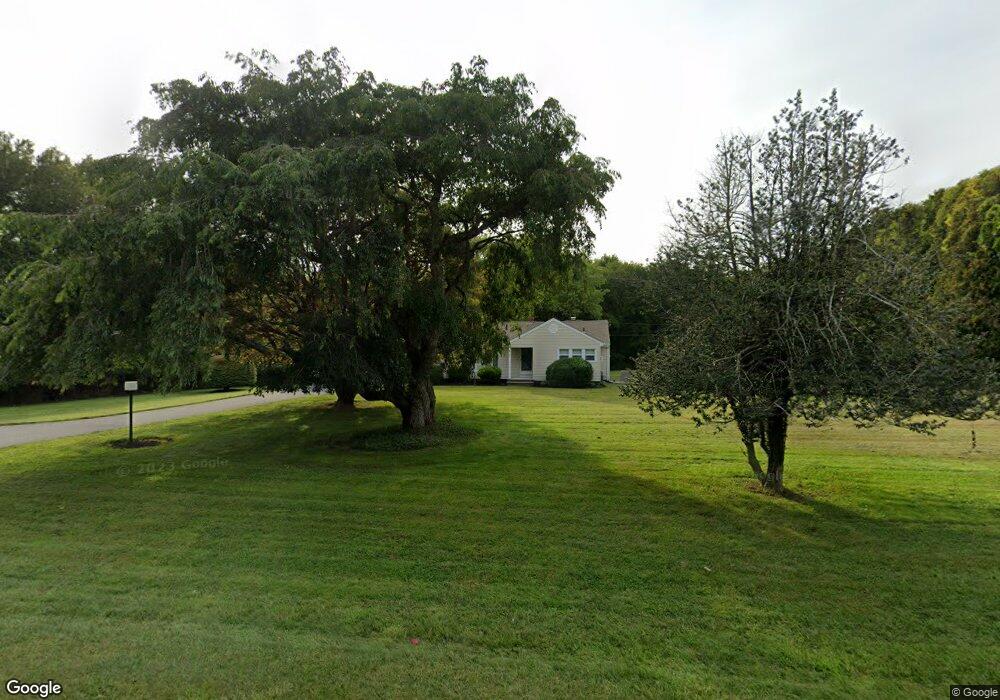
615 Main Rd Westport, MA 02790
Booth/Handy Four Corners NeighborhoodEstimated Value: $500,635 - $559,000
3
Beds
2
Baths
1,448
Sq Ft
$362/Sq Ft
Est. Value
About This Home
This home is located at 615 Main Rd, Westport, MA 02790 and is currently estimated at $523,909, approximately $361 per square foot. 615 Main Rd is a home located in Bristol County with nearby schools including Alice A. Macomber Primary School, Westport Elementary School, and Westport Middle-High School.
Ownership History
Date
Name
Owned For
Owner Type
Purchase Details
Closed on
Aug 22, 2017
Sold by
Marquis Yvonne
Bought by
201 Yvonne Marquis Ret
Current Estimated Value
Purchase Details
Closed on
Jul 29, 1985
Bought by
Marquis Yvonne
Create a Home Valuation Report for This Property
The Home Valuation Report is an in-depth analysis detailing your home's value as well as a comparison with similar homes in the area
Home Values in the Area
Average Home Value in this Area
Purchase History
| Date | Buyer | Sale Price | Title Company |
|---|---|---|---|
| 201 Yvonne Marquis Ret | -- | -- | |
| Marquis Yvonne | -- | -- |
Source: Public Records
Mortgage History
| Date | Status | Borrower | Loan Amount |
|---|---|---|---|
| Previous Owner | Marquis Yvonne | $10,000 | |
| Previous Owner | Marquis Yvonne | $25,000 |
Source: Public Records
Tax History Compared to Growth
Tax History
| Year | Tax Paid | Tax Assessment Tax Assessment Total Assessment is a certain percentage of the fair market value that is determined by local assessors to be the total taxable value of land and additions on the property. | Land | Improvement |
|---|---|---|---|---|
| 2025 | $3,044 | $408,600 | $176,800 | $231,800 |
| 2024 | $2,978 | $385,300 | $156,700 | $228,600 |
| 2023 | $2,801 | $343,200 | $135,600 | $207,600 |
| 2022 | $2,529 | $311,900 | $135,600 | $176,300 |
| 2021 | $5,134 | $293,400 | $117,100 | $176,300 |
| 2020 | $5,166 | $282,800 | $106,500 | $176,300 |
| 2019 | $2,314 | $279,800 | $106,500 | $173,300 |
| 2018 | $4,898 | $274,800 | $116,900 | $157,900 |
| 2017 | $4,354 | $268,100 | $113,200 | $154,900 |
| 2016 | $1,978 | $250,000 | $109,400 | $140,600 |
| 2015 | $1,893 | $238,700 | $111,900 | $126,800 |
Source: Public Records
Map
Nearby Homes
- 15 Village Way
- 7 Village Way
- 8 Village Way
- 8 Strawberry Ln
- 837 Main Rd
- 118 Charlotte White Rd Extension
- 0 Hidden Glen Ln
- 118 Charlotte White Rd
- 101 Adamsville Rd
- 978 Sodom Rd
- 920 Drift Rd
- 225 Hixbridge Rd
- Lot 0 Marcotte
- 47 Fallon Dr
- 6 Angel Ct
- 4 Main Rd
- 73 White Oak Run
- 1346 Main Rd Unit B
- 308 Robert St
- 47 Robert St