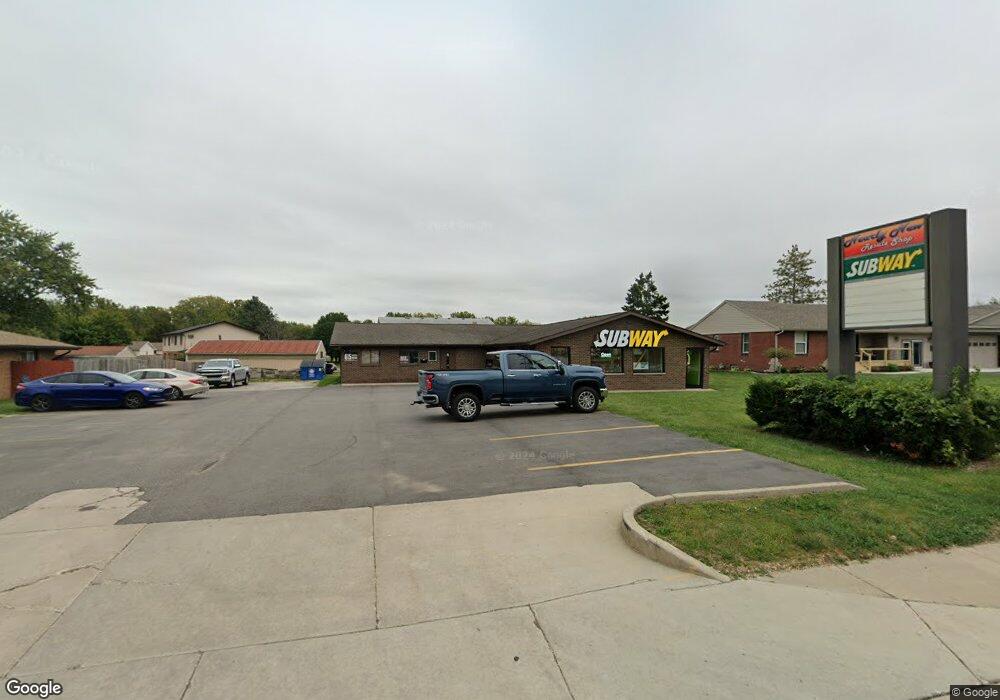
615 N Main St Unit B Hebron, IN 46341
Porter County NeighborhoodEstimated Value: $184,327
Studio
--
Bath
758
Sq Ft
$243/Sq Ft
Est. Value
About This Home
This home is located at 615 N Main St Unit B, Hebron, IN 46341 and is currently estimated at $184,327, approximately $243 per square foot. 615 N Main St Unit B is a home located in Porter County with nearby schools including Hebron Elementary School, Hebron Middle School, and Hebron High School.
Ownership History
Date
Name
Owned For
Owner Type
Purchase Details
Closed on
Oct 4, 2023
Sold by
Koschal Properties Llc
Bought by
Super Subs Inc
Current Estimated Value
Purchase Details
Closed on
Nov 1, 2017
Sold by
Koschal Robert S
Bought by
Koschal Properties Llc
Home Financials for this Owner
Home Financials are based on the most recent Mortgage that was taken out on this home.
Original Mortgage
$3,075,000
Interest Rate
3.99%
Mortgage Type
Commercial
Purchase Details
Closed on
Aug 5, 2005
Sold by
Yudt William M and Yudt Cecilia C
Bought by
Koschal Robert S
Create a Home Valuation Report for This Property
The Home Valuation Report is an in-depth analysis detailing your home's value as well as a comparison with similar homes in the area
Home Values in the Area
Average Home Value in this Area
Purchase History
| Date | Buyer | Sale Price | Title Company |
|---|---|---|---|
| Super Subs Inc | -- | Fidelity National Title | |
| Koschal Properties Llc | -- | Liberty Title & Escrow | |
| Koschal Robert S | -- | Liberty Title & Escrow Co | |
| Koschal Robert S | -- | -- |
Source: Public Records
Mortgage History
| Date | Status | Borrower | Loan Amount |
|---|---|---|---|
| Previous Owner | Koschal Properties Llc | $3,075,000 |
Source: Public Records
Map
Nearby Homes
Your Personal Tour Guide
Ask me questions while you tour the home.