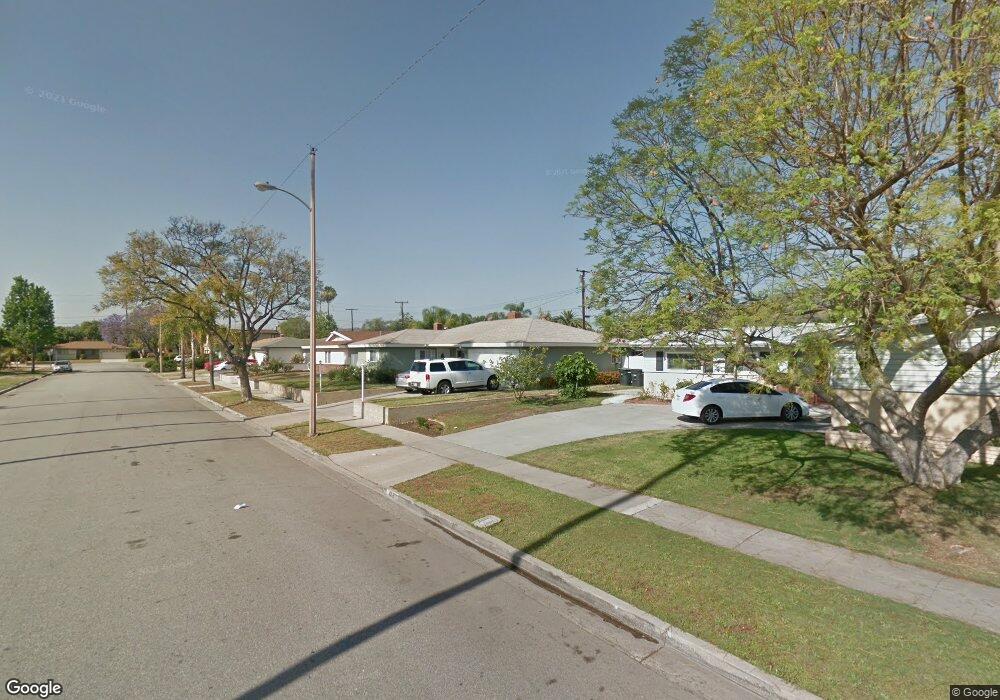
615 N Wrightwood Dr Orange, CA 92869
Estimated Value: $766,000 - $1,008,000
3
Beds
2
Baths
1,170
Sq Ft
$770/Sq Ft
Est. Value
About This Home
This home is located at 615 N Wrightwood Dr, Orange, CA 92869 and is currently estimated at $900,505, approximately $769 per square foot. 615 N Wrightwood Dr is a home located in Orange County with nearby schools including Esplanade Elementary School, El Modena High School, and Orange County Classical Academy.
Ownership History
Date
Name
Owned For
Owner Type
Purchase Details
Closed on
Jul 11, 2013
Sold by
Bash Richard
Bought by
Bash Vicki
Current Estimated Value
Purchase Details
Closed on
May 21, 2003
Sold by
Montgomery Patricia
Bought by
Gardener Vicki
Home Financials for this Owner
Home Financials are based on the most recent Mortgage that was taken out on this home.
Original Mortgage
$238,750
Outstanding Balance
$99,751
Interest Rate
5.26%
Mortgage Type
Purchase Money Mortgage
Estimated Equity
$800,754
Purchase Details
Closed on
May 14, 2003
Sold by
Hedges Helen M
Bought by
Montgomery Patricia A and Joseph A & Helen M Hedges Revocable Tr
Home Financials for this Owner
Home Financials are based on the most recent Mortgage that was taken out on this home.
Original Mortgage
$238,750
Outstanding Balance
$99,751
Interest Rate
5.26%
Mortgage Type
Purchase Money Mortgage
Estimated Equity
$800,754
Purchase Details
Closed on
Sep 24, 1997
Sold by
Hedges Joseph A and Hedges Helen M
Bought by
Hedges Joseph A and Hedges Helen M
Create a Home Valuation Report for This Property
The Home Valuation Report is an in-depth analysis detailing your home's value as well as a comparison with similar homes in the area
Home Values in the Area
Average Home Value in this Area
Purchase History
| Date | Buyer | Sale Price | Title Company |
|---|---|---|---|
| Bash Vicki | -- | None Available | |
| Bash Vicki | -- | None Available | |
| Gardener Vicki | $325,000 | Chicago Title | |
| Montgomery Patricia A | -- | -- | |
| Hedges Joseph A | -- | -- |
Source: Public Records
Mortgage History
| Date | Status | Borrower | Loan Amount |
|---|---|---|---|
| Open | Gardener Vicki | $238,750 |
Source: Public Records
Tax History
| Year | Tax Paid | Tax Assessment Tax Assessment Total Assessment is a certain percentage of the fair market value that is determined by local assessors to be the total taxable value of land and additions on the property. | Land | Improvement |
|---|---|---|---|---|
| 2025 | $5,182 | $462,073 | $381,727 | $80,346 |
| 2024 | $5,182 | $453,013 | $374,242 | $78,771 |
| 2023 | $5,066 | $444,131 | $366,904 | $77,227 |
| 2022 | $4,967 | $435,423 | $359,710 | $75,713 |
| 2021 | $4,830 | $426,886 | $352,657 | $74,229 |
| 2020 | $4,786 | $422,509 | $349,041 | $73,468 |
| 2019 | $4,727 | $414,225 | $342,197 | $72,028 |
| 2018 | $4,656 | $406,103 | $335,487 | $70,616 |
| 2017 | $4,465 | $398,141 | $328,909 | $69,232 |
| 2016 | $4,380 | $390,335 | $322,460 | $67,875 |
| 2015 | $4,316 | $384,472 | $317,616 | $66,856 |
| 2014 | $4,224 | $376,941 | $311,394 | $65,547 |
Source: Public Records
Map
Nearby Homes
- 4024 E Del Valle Ave
- 478 N Swidler St
- 3527 E Barrington Dr
- 3801 E Spring St
- 18946 E Berrytree Ln
- 972 N Big Sky Ln
- 605 N Pageant Dr Unit B
- 994 N Big Sky Ln
- 448 N Londonderry Ln Unit D
- 3406 E Lochleven Ln Unit B
- 10762 Center Dr
- 19091 E Country Hollow Unit 34
- 1024 N Cheyenne St
- 10722 Adams Cir
- 19031 E Center Ave
- 692 N Adele St Unit 50
- 692 N Adele St Unit 78
- 2929 E Hamilton Ave
- 4900 E Chapman Ave Unit 51
- 4223 E Marmon Ave
- 625 N Wrightwood Dr
- 605 N Wrightwood Dr
- 618 N Earlham St
- 628 N Earlham St
- 608 N Earlham St
- 635 N Wrightwood Dr
- 595 N Wrightwood Dr
- 616 N Wrightwood Dr
- 638 N Earlham St
- 626 N Wrightwood Dr
- 606 N Wrightwood Dr
- 598 N Earlham St
- 645 N Wrightwood Dr
- 593 N Wrightwood Dr
- 636 N Wrightwood Dr
- 594 N Wrightwood Dr
- 648 N Earlham St
- 590 N Earlham St
- 11332 Earlham St
- 646 N Wrightwood Dr
Your Personal Tour Guide
Ask me questions while you tour the home.