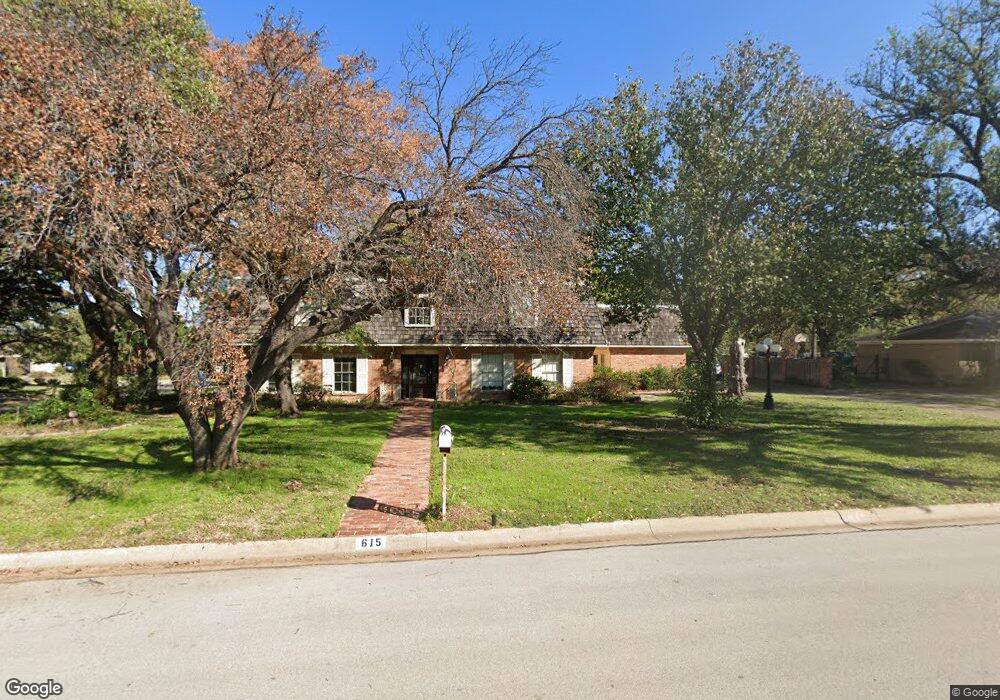
615 Ridgecrest Cir Denton, TX 76205
South Denton NeighborhoodEstimated Value: $577,229 - $648,000
3
Beds
3
Baths
3,556
Sq Ft
$169/Sq Ft
Est. Value
About This Home
This home is located at 615 Ridgecrest Cir, Denton, TX 76205 and is currently estimated at $601,557, approximately $169 per square foot. 615 Ridgecrest Cir is a home located in Denton County with nearby schools including Houston Elementary School, McMath Middle School, and Denton High School.
Ownership History
Date
Name
Owned For
Owner Type
Purchase Details
Closed on
Oct 25, 2017
Sold by
Od Texas D Llc
Bought by
Kirkland Jason M and Kirkland Chantal
Current Estimated Value
Home Financials for this Owner
Home Financials are based on the most recent Mortgage that was taken out on this home.
Original Mortgage
$342,000
Outstanding Balance
$286,048
Interest Rate
3.78%
Mortgage Type
New Conventional
Estimated Equity
$315,509
Purchase Details
Closed on
Aug 29, 2017
Sold by
Fletcher Don E and Fletcher Margaret C
Bought by
Od Texas D Llc
Home Financials for this Owner
Home Financials are based on the most recent Mortgage that was taken out on this home.
Original Mortgage
$342,000
Outstanding Balance
$286,048
Interest Rate
3.78%
Mortgage Type
New Conventional
Estimated Equity
$315,509
Create a Home Valuation Report for This Property
The Home Valuation Report is an in-depth analysis detailing your home's value as well as a comparison with similar homes in the area
Home Values in the Area
Average Home Value in this Area
Purchase History
| Date | Buyer | Sale Price | Title Company |
|---|---|---|---|
| Kirkland Jason M | -- | Fidelity National Title | |
| Od Texas D Llc | -- | Fidelity National Title |
Source: Public Records
Mortgage History
| Date | Status | Borrower | Loan Amount |
|---|---|---|---|
| Open | Kirkland Jason M | $342,000 | |
| Previous Owner | Od Texas D Llc | $150,000,000 |
Source: Public Records
Tax History Compared to Growth
Tax History
| Year | Tax Paid | Tax Assessment Tax Assessment Total Assessment is a certain percentage of the fair market value that is determined by local assessors to be the total taxable value of land and additions on the property. | Land | Improvement |
|---|---|---|---|---|
| 2025 | $8,977 | $523,652 | $124,969 | $398,683 |
| 2024 | $10,174 | $527,076 | $0 | $0 |
| 2023 | $7,952 | $479,160 | $118,681 | $385,319 |
| 2022 | $9,247 | $435,600 | $110,267 | $408,208 |
| 2021 | $8,803 | $396,000 | $73,511 | $322,489 |
| 2020 | $9,052 | $396,000 | $73,511 | $322,489 |
| 2019 | $8,948 | $375,000 | $73,511 | $301,489 |
| 2018 | $9,118 | $377,473 | $73,511 | $303,962 |
| 2017 | $7,249 | $293,269 | $73,511 | $219,758 |
| 2016 | $4,129 | $267,900 | $73,511 | $194,389 |
| 2015 | $3,872 | $251,682 | $73,511 | $178,171 |
| 2013 | -- | $233,719 | $83,710 | $150,009 |
Source: Public Records
Map
Nearby Homes
- 1412 Ridgecrest Cir
- 209 Pennsylvania Dr
- 2218 Southridge Dr
- 2272 Hollyhill Ln
- 2253 Hollyhill Ln
- 924 Ridgecrest Cir
- 2544 Natchez Trace
- 2012 Hollyhill Ln
- 2501 Great Bear Ln
- 916 Smokerise Cir
- 1541 Valley Creek Rd
- 1500 Sandy Creek Dr
- 1000 Lynhurst Ln
- 412 Hollyhill Ln Unit 412
- 408 Hollyhill Ln
- 1536 Valley Creek Rd
- 720 Smokerise Cir
- 2009 Lake Fork Ct
- 1012 Indian Ridge Dr
- 2226 Savannah Trail
- 619 Ridgecrest Cir
- 1507 Ridgecrest Cir
- 605 Ridgecrest Cir
- 612 Ridgecrest Cir
- 618 Ridgecrest Cir
- 1500 Ridgecrest Cir
- 701 Ridgecrest Cir
- 1505 Ridgecrest Cir
- 606 Ridgecrest Cir
- 700 Ridgecrest Cir
- 601 Ridgecrest Cir
- 1428 Ridgecrest Cir
- 706 Ridgecrest Cir
- 1501 Ridgecrest Cir
- 707 Ridgecrest Cir
- 600 Ridgecrest Cir
- 111 Ridgecrest Cir
- 113 Ridgecrest Cir
- 1424 Ridgecrest Cir
- 525 Ridgecrest Cir