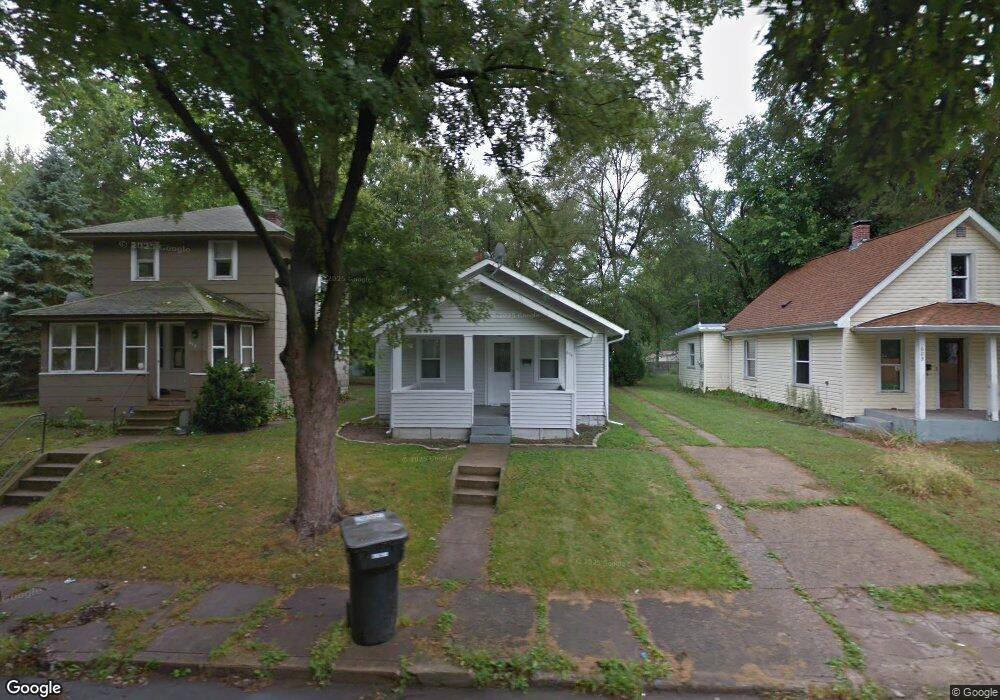
615 S 29th St South Bend, IN 46615
River Park NeighborhoodEstimated Value: $95,000 - $114,834
2
Beds
1
Bath
864
Sq Ft
$126/Sq Ft
Est. Value
About This Home
This home is located at 615 S 29th St, South Bend, IN 46615 and is currently estimated at $108,459, approximately $125 per square foot. 615 S 29th St is a home located in St. Joseph County with nearby schools including Cora B. Darling Elementary School, Nuner Fine Arts Academy, and Clay Intermediate Center.
Ownership History
Date
Name
Owned For
Owner Type
Purchase Details
Closed on
Sep 30, 2021
Sold by
Bourthoumieu John
Bought by
Aldridge James and Aldridge Natalie
Current Estimated Value
Home Financials for this Owner
Home Financials are based on the most recent Mortgage that was taken out on this home.
Original Mortgage
$58,913
Outstanding Balance
$53,723
Interest Rate
2.8%
Mortgage Type
FHA
Estimated Equity
$54,736
Purchase Details
Closed on
Sep 29, 2021
Sold by
Bourthoumieu John
Bought by
Aldridge James and Aldridge Natalie
Home Financials for this Owner
Home Financials are based on the most recent Mortgage that was taken out on this home.
Original Mortgage
$58,913
Outstanding Balance
$53,723
Interest Rate
2.8%
Mortgage Type
FHA
Estimated Equity
$54,736
Purchase Details
Closed on
Sep 28, 2010
Sold by
Bourthoumieu John
Bought by
Coffman Lisa Marie
Purchase Details
Closed on
Sep 29, 2009
Sold by
Penn Tashana Marie
Bought by
Bourthoumieu John
Home Financials for this Owner
Home Financials are based on the most recent Mortgage that was taken out on this home.
Original Mortgage
$60,500
Interest Rate
5.19%
Mortgage Type
Seller Take Back
Create a Home Valuation Report for This Property
The Home Valuation Report is an in-depth analysis detailing your home's value as well as a comparison with similar homes in the area
Home Values in the Area
Average Home Value in this Area
Purchase History
| Date | Buyer | Sale Price | Title Company |
|---|---|---|---|
| Aldridge James | $60,000 | Metropolitan Title | |
| Aldridge James | -- | Metropolitan Title | |
| Coffman Lisa Marie | $66,000 | None Available | |
| Bourthoumieu John | -- | None Available | |
| Bourthournieu John | $66,500 | Metropolitan Title In Llc |
Source: Public Records
Mortgage History
| Date | Status | Borrower | Loan Amount |
|---|---|---|---|
| Open | Aldridge James | $58,913 | |
| Closed | Aldridge James | $58,913 | |
| Previous Owner | Bourthournieu John | $60,500 | |
| Closed | Coffman Lisa Marie | $0 |
Source: Public Records
Tax History Compared to Growth
Tax History
| Year | Tax Paid | Tax Assessment Tax Assessment Total Assessment is a certain percentage of the fair market value that is determined by local assessors to be the total taxable value of land and additions on the property. | Land | Improvement |
|---|---|---|---|---|
| 2024 | $1,049 | $99,200 | $5,600 | $93,600 |
| 2023 | $835 | $87,800 | $5,600 | $82,200 |
| 2022 | $878 | $72,100 | $5,600 | $66,500 |
| 2021 | $731 | $64,400 | $3,600 | $60,800 |
| 2020 | $631 | $55,200 | $3,100 | $52,100 |
| 2019 | $494 | $47,800 | $2,500 | $45,300 |
| 2018 | $419 | $40,800 | $2,100 | $38,700 |
| 2017 | $421 | $40,300 | $2,100 | $38,200 |
| 2016 | $450 | $42,000 | $3,800 | $38,200 |
| 2014 | $482 | $46,900 | $3,800 | $43,100 |
Source: Public Records
Map
Nearby Homes
- 525 S 28th St
- 537 S 27th St
- 634 S 26th St
- 513 S 26th St
- 806 S 26th St
- 815 S 26th St
- 734 S 33rd St
- 3312 E Jefferson Square
- 715 S 35th St
- 510 S Ironwood Dr
- 1105 S 35th St
- 3312 Mishawaka Ave
- 1111 S 27th St
- 741 S 36th St
- 930 S 34th St
- 3517 Mishawaka Ave
- 1017 S 23rd St
- 110 S 33rd St
- 1019 W Lawrence St
- 2001 E Jefferson Blvd