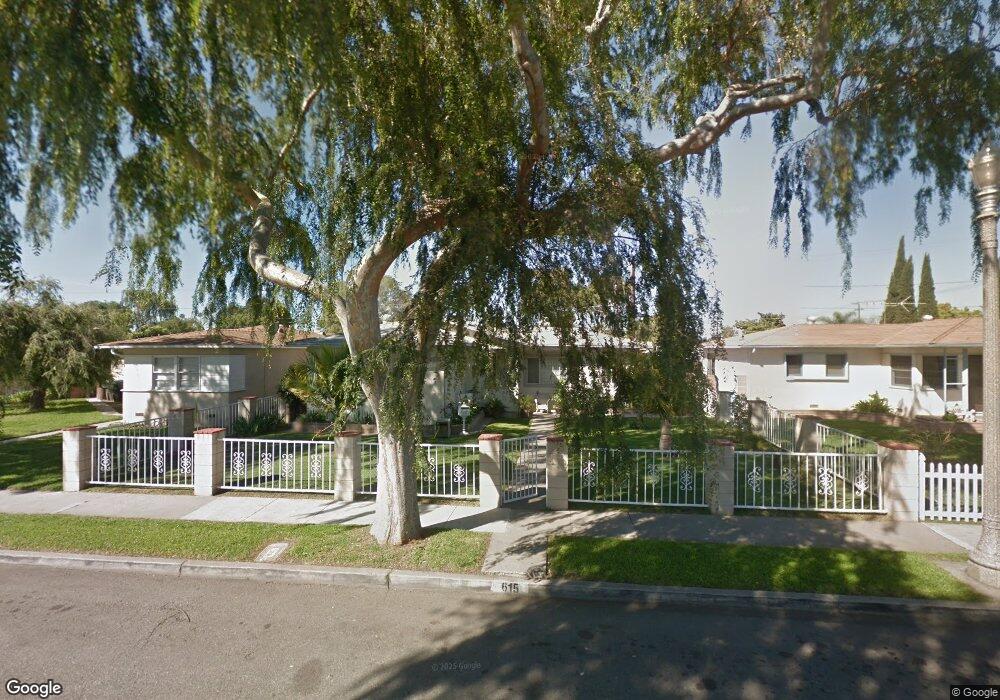
615 S Pine St Anaheim, CA 92805
The Colony NeighborhoodEstimated Value: $796,350 - $826,000
3
Beds
1
Bath
1,101
Sq Ft
$736/Sq Ft
Est. Value
About This Home
This home is located at 615 S Pine St, Anaheim, CA 92805 and is currently estimated at $810,838, approximately $736 per square foot. 615 S Pine St is a home located in Orange County with nearby schools including Benjamin Franklin Elementary School, Sycamore Junior High School, and Anaheim High School.
Ownership History
Date
Name
Owned For
Owner Type
Purchase Details
Closed on
Sep 3, 1999
Sold by
Hud
Bought by
Esquivel Luis and Esquivel Maria
Current Estimated Value
Home Financials for this Owner
Home Financials are based on the most recent Mortgage that was taken out on this home.
Original Mortgage
$140,650
Outstanding Balance
$42,178
Interest Rate
7.97%
Mortgage Type
FHA
Estimated Equity
$768,660
Purchase Details
Closed on
Mar 25, 1999
Sold by
Cira Quiroz and Vicente Martinez Vicente
Bought by
Countrywide Home Loans Inc
Purchase Details
Closed on
Dec 23, 1998
Sold by
Countrywide Home Loans Inc
Bought by
Hud
Purchase Details
Closed on
Oct 10, 1996
Sold by
Vicente Martinez and Vicente Jose
Bought by
Quiroz Cira
Purchase Details
Closed on
Jul 7, 1995
Sold by
Cramer Bruce J and Cramer Elizabeth J
Bought by
Quiroz Cira and Martinez Vicente
Home Financials for this Owner
Home Financials are based on the most recent Mortgage that was taken out on this home.
Original Mortgage
$143,865
Interest Rate
7.83%
Mortgage Type
FHA
Create a Home Valuation Report for This Property
The Home Valuation Report is an in-depth analysis detailing your home's value as well as a comparison with similar homes in the area
Home Values in the Area
Average Home Value in this Area
Purchase History
| Date | Buyer | Sale Price | Title Company |
|---|---|---|---|
| Esquivel Luis | $145,000 | Benefit Land Title Company | |
| Countrywide Home Loans Inc | $154,379 | Landsafe Title | |
| Hud | -- | Landsafe Title | |
| Quiroz Cira | -- | -- | |
| Quiroz Cira | $146,500 | Orange Coast Title Company |
Source: Public Records
Mortgage History
| Date | Status | Borrower | Loan Amount |
|---|---|---|---|
| Open | Esquivel Luis | $140,650 | |
| Previous Owner | Quiroz Cira | $143,865 |
Source: Public Records
Tax History
| Year | Tax Paid | Tax Assessment Tax Assessment Total Assessment is a certain percentage of the fair market value that is determined by local assessors to be the total taxable value of land and additions on the property. | Land | Improvement |
|---|---|---|---|---|
| 2025 | $3,046 | $253,589 | $197,046 | $56,543 |
| 2024 | $3,046 | $248,617 | $193,182 | $55,435 |
| 2023 | $2,978 | $243,743 | $189,394 | $54,349 |
| 2022 | $2,936 | $238,964 | $185,680 | $53,284 |
| 2021 | $2,937 | $234,279 | $182,039 | $52,240 |
| 2020 | $2,923 | $231,877 | $180,172 | $51,705 |
| 2019 | $2,840 | $227,331 | $176,639 | $50,692 |
| 2018 | $2,781 | $222,874 | $173,175 | $49,699 |
| 2017 | $2,675 | $218,504 | $169,779 | $48,725 |
| 2016 | $2,664 | $214,220 | $166,450 | $47,770 |
| 2015 | $2,638 | $211,003 | $163,950 | $47,053 |
| 2014 | $2,481 | $206,870 | $160,738 | $46,132 |
Source: Public Records
Map
Nearby Homes
- 615 S Helena St
- 612 W Santa Ana St
- 701 W Provential Dr
- 843 S Helena St
- 523 S Citron St
- 833 S Lemon St
- 836 S Bellevue Place
- 326 S Clementine St
- 713 S Anaheim Blvd
- 809 S Anaheim Blvd Unit 106
- 813 S Anaheim Blvd Unit 101
- 520 S Anaheim Blvd Unit 1
- 510 S Anaheim Blvd Unit 7
- 718 S Claudina St
- 825 S Claudina St
- 330 S Illinois St
- 435 W Center Street Promenade Unit 323
- 435 W Center Street Promenade Unit 401
- 1028 S Citron St Unit 16
- 1866 S Westside Dr Unit 26
Your Personal Tour Guide
Ask me questions while you tour the home.