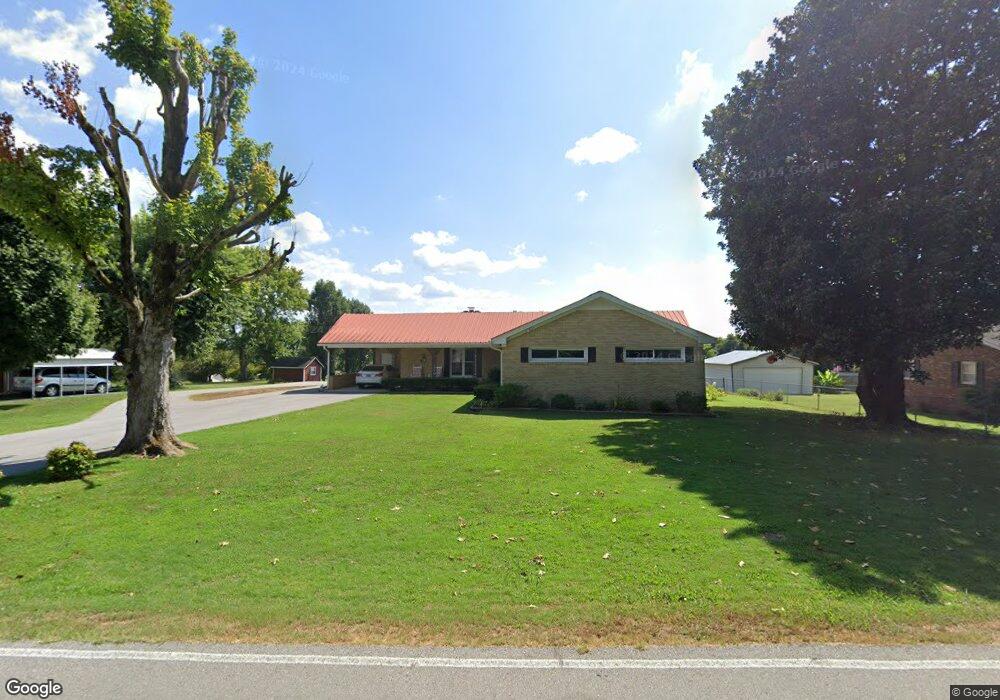
615 Turn Table Rd Sparta, TN 38583
Estimated Value: $311,881 - $406,000
--
Bed
2
Baths
1,935
Sq Ft
$192/Sq Ft
Est. Value
About This Home
This home is located at 615 Turn Table Rd, Sparta, TN 38583 and is currently estimated at $371,720, approximately $192 per square foot. 615 Turn Table Rd is a home located in White County with nearby schools including Findlay Elementary School, White County Middle School, and White County High School.
Ownership History
Date
Name
Owned For
Owner Type
Purchase Details
Closed on
May 3, 2019
Sold by
Copeland Charles Anthony and Copeland Mindy
Bought by
Carroll Herman and Carroll Rhonda
Current Estimated Value
Purchase Details
Closed on
Mar 26, 2012
Sold by
Underwood Marshall H
Bought by
Copeland Charles Anthony and Copeland Mindy Louann
Purchase Details
Closed on
Oct 4, 2004
Sold by
Smith Herbert L
Bought by
Underwood Marshall H
Home Financials for this Owner
Home Financials are based on the most recent Mortgage that was taken out on this home.
Original Mortgage
$95,000
Interest Rate
5.71%
Purchase Details
Closed on
Oct 1, 1993
Bought by
Smith Herbert L and Smith Jo Ann
Purchase Details
Closed on
Aug 15, 1983
Bought by
Witzigman James W and Witzigman Barbara
Create a Home Valuation Report for This Property
The Home Valuation Report is an in-depth analysis detailing your home's value as well as a comparison with similar homes in the area
Home Values in the Area
Average Home Value in this Area
Purchase History
| Date | Buyer | Sale Price | Title Company |
|---|---|---|---|
| Carroll Herman | $210,000 | None Available | |
| Carroll Herman | $210,000 | None Available | |
| Copeland Charles Anthony | $160,000 | -- | |
| Copeland Charles Anthony | $160,000 | -- | |
| Underwood Marshall H | $145,000 | -- | |
| Underwood Marshall H | $145,000 | -- | |
| Smith Herbert L | $80,000 | -- | |
| Smith Herbert L | $80,000 | -- | |
| Witzigman James W | -- | -- | |
| Witzigman James W | -- | -- |
Source: Public Records
Mortgage History
| Date | Status | Borrower | Loan Amount |
|---|---|---|---|
| Previous Owner | Witzigman James W | $95,000 |
Source: Public Records
Tax History Compared to Growth
Tax History
| Year | Tax Paid | Tax Assessment Tax Assessment Total Assessment is a certain percentage of the fair market value that is determined by local assessors to be the total taxable value of land and additions on the property. | Land | Improvement |
|---|---|---|---|---|
| 2025 | -- | $91,175 | $0 | $0 |
| 2024 | -- | $54,275 | $4,200 | $50,075 |
| 2023 | $0 | $54,275 | $4,200 | $50,075 |
| 2022 | $1,611 | $54,275 | $4,200 | $50,075 |
| 2021 | $1,611 | $54,275 | $4,200 | $50,075 |
| 2020 | $1,611 | $54,275 | $4,200 | $50,075 |
| 2019 | $1,175 | $37,925 | $3,000 | $34,925 |
| 2018 | $1,175 | $37,925 | $3,000 | $34,925 |
| 2017 | $1,175 | $37,925 | $3,000 | $34,925 |
| 2016 | $1,175 | $37,925 | $3,000 | $34,925 |
| 2015 | $1,100 | $37,925 | $3,000 | $34,925 |
| 2014 | -- | $37,925 | $3,000 | $34,925 |
| 2013 | -- | $38,475 | $3,000 | $35,475 |
Source: Public Records
Map
Nearby Homes
- 548 Turntable Rd
- 548 Turn Table Rd
- 613 Hale St
- 00 N Spring St
- 0 Roberts Matthews Hwy
- 00 Roberts Matthews Hwy
- 731 Howell St
- 0 Millers Point Rd
- 235 Dairy Barn
- 671 N Spring St
- 202 Gillen Dr
- 210 Gillen Dr
- 1178 Ray Broyles Rd
- 249 N Spring St
- 1945 Golden Mountain Rd
- 611 Imperial Dr
- 936 N Spring St
- 673 Charles Golden Rd
- 1644 Walker Cove Rd
- 0 Moore St
- 615 Turntable Rd
- 611 Turn Table Rd
- 619 Turn Table Rd
- 619 Turntable Rd
- 622 Madison Ave
- 623 Turn Table Rd
- 607 Turn Table Rd
- 614 Turn Table Rd
- 626 Madison Ave
- 606 Turntable Rd
- 606 Turn Table Rd
- 627 Turn Table Rd
- 610 Madison Ave
- 603 Turn Table Rd
- 630 Madison Ave
- 603 Turntable Rd
- 619 Madison Ave
- .5 acres Madison Ave
- 623 Madison Ave
- 634 Madison Ave