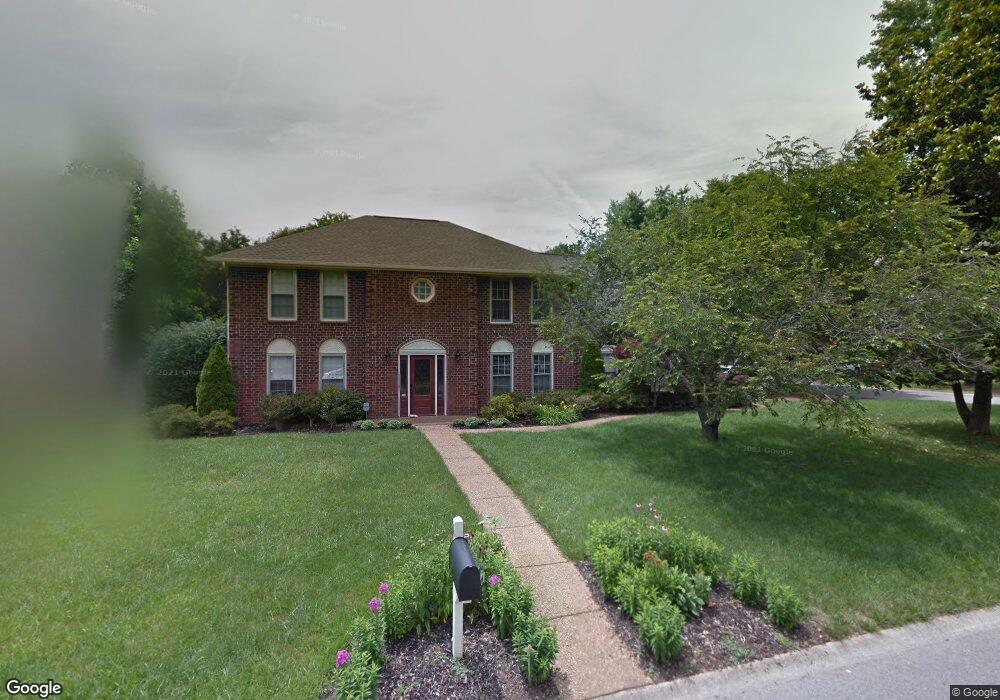
615 Watson Branch Dr Franklin, TN 37064
McEwen NeighborhoodEstimated Value: $732,000 - $793,000
4
Beds
3
Baths
2,794
Sq Ft
$273/Sq Ft
Est. Value
About This Home
This home is located at 615 Watson Branch Dr, Franklin, TN 37064 and is currently estimated at $763,016, approximately $273 per square foot. 615 Watson Branch Dr is a home located in Williamson County with nearby schools including Moore Elementary School, Freedom Intermediate School, and Freedom Middle School.
Ownership History
Date
Name
Owned For
Owner Type
Purchase Details
Closed on
Nov 7, 2005
Sold by
Eddy Chris and Eddy Connie
Bought by
Potts Jason L and Potts Amy L
Current Estimated Value
Home Financials for this Owner
Home Financials are based on the most recent Mortgage that was taken out on this home.
Original Mortgage
$211,900
Interest Rate
5.84%
Mortgage Type
Fannie Mae Freddie Mac
Purchase Details
Closed on
Sep 30, 2002
Sold by
Chambless Daniel D and Chambless Susan C
Bought by
Eddy Chris and Eddy Connie
Home Financials for this Owner
Home Financials are based on the most recent Mortgage that was taken out on this home.
Original Mortgage
$182,750
Interest Rate
8.75%
Purchase Details
Closed on
Apr 7, 1998
Sold by
Mitchell Willie F and Mitchell Geneva A
Bought by
Chambless Daniel D and Eddy Connie M
Purchase Details
Closed on
Aug 30, 1994
Sold by
Roald Humphrey
Bought by
Chambless Daniel D
Create a Home Valuation Report for This Property
The Home Valuation Report is an in-depth analysis detailing your home's value as well as a comparison with similar homes in the area
Home Values in the Area
Average Home Value in this Area
Purchase History
| Date | Buyer | Sale Price | Title Company |
|---|---|---|---|
| Potts Jason L | $264,900 | Homeland Title Inc | |
| Eddy Chris | $205,000 | -- | |
| Chambless Daniel D | -- | Bridgehouse Title Company | |
| Chambless Daniel D | -- | -- |
Source: Public Records
Mortgage History
| Date | Status | Borrower | Loan Amount |
|---|---|---|---|
| Closed | Potts Jason L | $211,900 | |
| Previous Owner | Eddy Chris | $182,750 |
Source: Public Records
Tax History Compared to Growth
Tax History
| Year | Tax Paid | Tax Assessment Tax Assessment Total Assessment is a certain percentage of the fair market value that is determined by local assessors to be the total taxable value of land and additions on the property. | Land | Improvement |
|---|---|---|---|---|
| 2024 | $3,518 | $124,250 | $22,500 | $101,750 |
| 2023 | $3,381 | $124,250 | $22,500 | $101,750 |
| 2022 | $3,381 | $124,250 | $22,500 | $101,750 |
| 2021 | $3,381 | $124,250 | $22,500 | $101,750 |
| 2020 | $2,787 | $86,375 | $20,000 | $66,375 |
| 2019 | $2,787 | $86,375 | $20,000 | $66,375 |
| 2018 | $2,727 | $86,375 | $20,000 | $66,375 |
| 2017 | $2,684 | $86,375 | $20,000 | $66,375 |
| 2016 | $2,675 | $86,375 | $20,000 | $66,375 |
| 2015 | -- | $69,450 | $16,250 | $53,200 |
| 2014 | -- | $69,450 | $16,250 | $53,200 |
Source: Public Records
Map
Nearby Homes
- 521 Maplegrove Dr
- 521 Shadycrest Ln
- 205 Jennette Place
- 2801 Kennedy Ct Unit 2801
- 306 Battery Ct
- 2741 Kennedy Ct Unit 2741
- 697 Watson Branch Dr
- 1011 Murfreesboro Rd Unit E3
- 1011 Murfreesboro Rd Unit B2
- 1011 Murfreesboro Rd Unit D3
- 2433 Kennedy Ct Unit 2433
- 713 Sugartree Ln
- 1143 Buckingham Cir
- 100 Ralston Ln
- 624 Burghley Ln
- 520 Castlebury Ct
- 1183 Buckingham Cir
- 100 Basil Ct
- 121 Pebble View Dr
- 1 Pinewood Rd
- 505 Maplegrove Dr
- 617 Watson Branch Dr
- 507 Maplegrove Dr
- 619 Watson Branch Dr
- 616 Watson Branch Dr
- 504 Maplegrove Dr
- 513 Maplegrove Dr
- 506 Maplegrove Dr
- 550 Watson Branch Dr
- 618 Watson Branch Dr
- 621 Watson Branch Dr
- 429 Maplegrove Dr
- 517 Maplegrove Dr
- 555 Watson Branch Dr
- 563 Watson Branch Dr
- 434 Maplegrove Dr
- 559 Watson Branch Dr
- 508 Maplegrove Dr
- 620 Watson Branch Dr
- 623 Watson Branch Dr