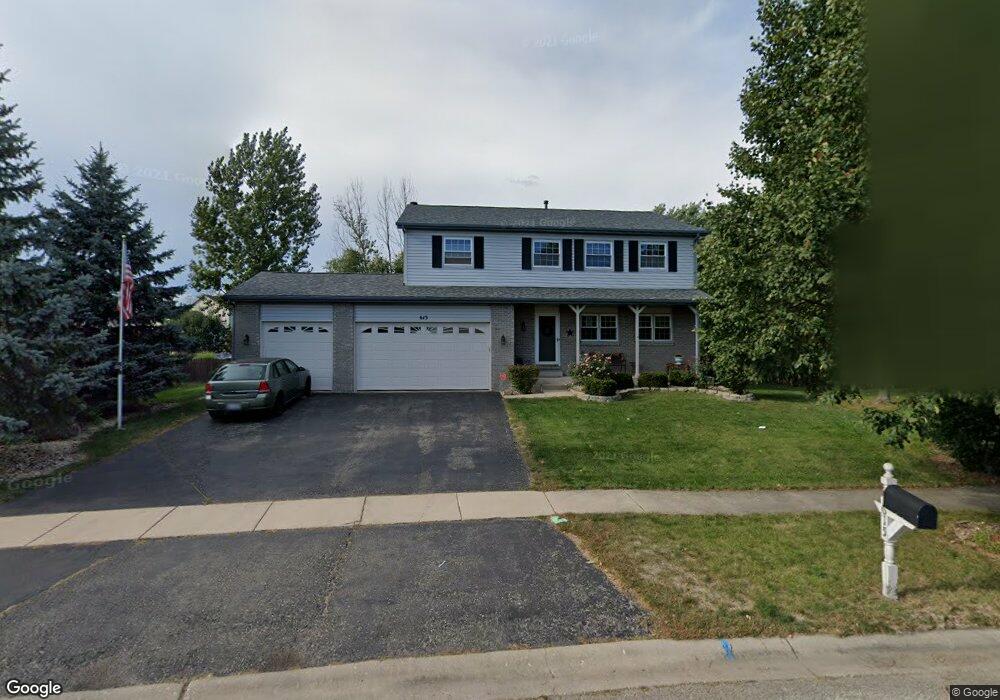
615 Woodchuck Trail Oswego, IL 60543
Northwest Oswego NeighborhoodEstimated Value: $397,000 - $423,000
4
Beds
4
Baths
2,194
Sq Ft
$187/Sq Ft
Est. Value
About This Home
This home is located at 615 Woodchuck Trail, Oswego, IL 60543 and is currently estimated at $410,196, approximately $186 per square foot. 615 Woodchuck Trail is a home located in Kendall County with nearby schools including Fox Chase Elementary School, Traughber Junior High School, and Oswego High School.
Ownership History
Date
Name
Owned For
Owner Type
Purchase Details
Closed on
Oct 21, 2009
Sold by
Horeni Russ
Bought by
Deaville John R and Deaville Kathleen A
Current Estimated Value
Home Financials for this Owner
Home Financials are based on the most recent Mortgage that was taken out on this home.
Original Mortgage
$180,750
Outstanding Balance
$118,208
Interest Rate
5.11%
Mortgage Type
New Conventional
Estimated Equity
$291,988
Purchase Details
Closed on
Jun 24, 2009
Sold by
Deutsche Bank National Trust Company
Bought by
Horeni Russ
Purchase Details
Closed on
May 12, 2009
Sold by
Simpson John F and Simpson Colleen C
Bought by
Deutsche Bank National Trust Company
Purchase Details
Closed on
Oct 25, 1996
Sold by
Marquette National Bank
Bought by
Simpson John F and Simpson Colleen C
Home Financials for this Owner
Home Financials are based on the most recent Mortgage that was taken out on this home.
Original Mortgage
$154,350
Interest Rate
7.12%
Create a Home Valuation Report for This Property
The Home Valuation Report is an in-depth analysis detailing your home's value as well as a comparison with similar homes in the area
Home Values in the Area
Average Home Value in this Area
Purchase History
| Date | Buyer | Sale Price | Title Company |
|---|---|---|---|
| Deaville John R | $241,000 | Chicago Title Insurance Co | |
| Horeni Russ | $165,000 | Forum Title Insurance Co | |
| Deutsche Bank National Trust Company | -- | None Available | |
| Simpson John F | $162,500 | -- |
Source: Public Records
Mortgage History
| Date | Status | Borrower | Loan Amount |
|---|---|---|---|
| Open | Deaville John R | $180,750 | |
| Previous Owner | Simpson John F | $154,350 |
Source: Public Records
Tax History Compared to Growth
Tax History
| Year | Tax Paid | Tax Assessment Tax Assessment Total Assessment is a certain percentage of the fair market value that is determined by local assessors to be the total taxable value of land and additions on the property. | Land | Improvement |
|---|---|---|---|---|
| 2024 | $8,937 | $111,911 | $13,302 | $98,609 |
| 2023 | $8,143 | $100,126 | $11,901 | $88,225 |
| 2022 | $8,143 | $90,899 | $10,804 | $80,095 |
| 2021 | $7,886 | $84,966 | $10,804 | $74,162 |
| 2020 | $7,642 | $82,114 | $10,804 | $71,310 |
| 2019 | $7,466 | $78,963 | $10,389 | $68,574 |
| 2018 | $7,223 | $73,485 | $10,389 | $63,096 |
| 2017 | $7,089 | $69,056 | $10,389 | $58,667 |
| 2016 | $6,740 | $64,410 | $10,389 | $54,021 |
| 2015 | $6,719 | $61,014 | $9,354 | $51,660 |
| 2014 | -- | $59,027 | $9,354 | $49,673 |
| 2013 | -- | $59,027 | $9,354 | $49,673 |
Source: Public Records
Map
Nearby Homes
- 435 Fawn Dr
- 409 Fawn Dr
- 629 Manhattan Cir
- 102 Mary St
- 173 Dolores St
- 466 Greenview Ln
- LOT 10 SW Station Dr
- 614 Pineridge Dr N Unit 43
- 147 Eisenhower Dr
- 2100 Light Rd Unit 109
- 2700 Light Rd Unit 205
- 517 Meadowwood Ln Unit 3
- 424 Grape Vine Trail
- 1721 State Route 31
- 37 N West Dr
- 505 Parkland Ct
- 403 Lake Ct
- 2721 Berrywood Ln
- 11-13 W Anchor Rd
- 7.43 Acres Vacant La State Route 31
- 613 Woodchuck Trail Unit 6
- 617 Woodchuck Trail Unit 6
- 616 Otter Way Unit 6
- 618 Otter Way
- 614 Otter Way Unit 6
- 704 Ferret Crossing Unit 6
- 612 Woodchuck Trail Unit 6
- 612 Otter Way
- 614 Woodchuck Trail
- 620 Otter Way Unit 6
- 609 Woodchuck Trail
- 608 Woodchuck Trail Unit 6
- 610 Otter Way
- 711 Ferret Crossing Unit 6
- 714 Ferret Crossing
- 709 Ferret Crossing
- 713 Ferret Crossing
- 607 Woodchuck Trail Unit 6
- 615 Otter Way Unit 6
- 613 Otter Way