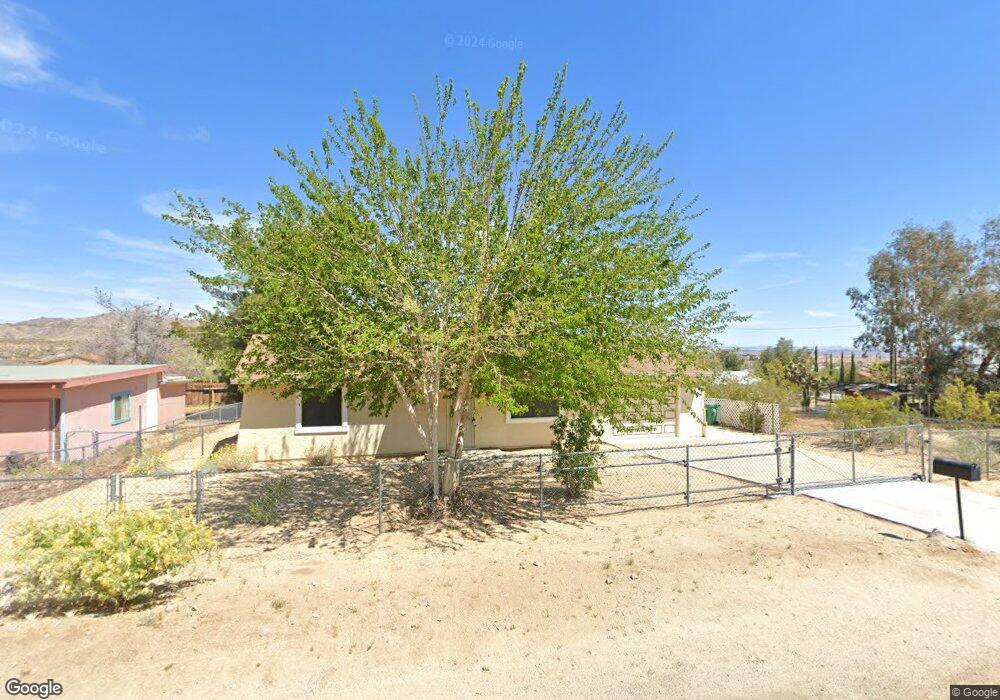
61506 El Reposo St Joshua Tree, CA 92252
Estimated Value: $263,076 - $350,000
2
Beds
1
Bath
814
Sq Ft
$382/Sq Ft
Est. Value
About This Home
This home is located at 61506 El Reposo St, Joshua Tree, CA 92252 and is currently estimated at $311,269, approximately $382 per square foot. 61506 El Reposo St is a home located in San Bernardino County with nearby schools including Joshua Tree Elementary School, La Contenta Middle School, and Yucca Valley High School.
Ownership History
Date
Name
Owned For
Owner Type
Purchase Details
Closed on
Mar 8, 2017
Sold by
Logan Hollye
Bought by
Logan Hollye R and Logan Michael L
Current Estimated Value
Purchase Details
Closed on
Apr 27, 1998
Sold by
Spencer Rimmel L and Brackett Family Trust
Bought by
Rufener Calvin D
Home Financials for this Owner
Home Financials are based on the most recent Mortgage that was taken out on this home.
Original Mortgage
$22,000
Outstanding Balance
$4,310
Interest Rate
7.13%
Mortgage Type
VA
Estimated Equity
$306,959
Create a Home Valuation Report for This Property
The Home Valuation Report is an in-depth analysis detailing your home's value as well as a comparison with similar homes in the area
Home Values in the Area
Average Home Value in this Area
Purchase History
| Date | Buyer | Sale Price | Title Company |
|---|---|---|---|
| Logan Hollye R | -- | None Available | |
| Rufener Calvin D | $32,500 | Commonwealth Land Title Co |
Source: Public Records
Mortgage History
| Date | Status | Borrower | Loan Amount |
|---|---|---|---|
| Open | Rufener Calvin D | $22,000 |
Source: Public Records
Tax History Compared to Growth
Tax History
| Year | Tax Paid | Tax Assessment Tax Assessment Total Assessment is a certain percentage of the fair market value that is determined by local assessors to be the total taxable value of land and additions on the property. | Land | Improvement |
|---|---|---|---|---|
| 2025 | $916 | $52,755 | $12,559 | $40,196 |
| 2024 | $916 | $51,721 | $12,313 | $39,408 |
| 2023 | $900 | $50,707 | $12,072 | $38,635 |
| 2022 | $883 | $49,712 | $11,835 | $37,877 |
| 2021 | $872 | $48,737 | $11,603 | $37,134 |
| 2020 | $864 | $48,237 | $11,484 | $36,753 |
| 2019 | $897 | $47,291 | $11,259 | $36,032 |
| 2018 | $733 | $46,363 | $11,038 | $35,325 |
| 2017 | $726 | $45,454 | $10,822 | $34,632 |
| 2016 | $716 | $44,563 | $10,610 | $33,953 |
| 2015 | $684 | $43,894 | $10,451 | $33,443 |
| 2014 | $708 | $43,034 | $10,246 | $32,788 |
Source: Public Records
Map
Nearby Homes
- 61493 Desert Air Rd
- 61538 El Reposo St
- 61464 Desert Air Rd
- 61504 Capilla Dr
- 61665 Division St
- 60851 Division St
- 61480 Division St
- 6746 Hillview Rd
- 61593 Capilla Dr
- 61329 Rocky Vista St
- 67000 29 Palms Hwy
- 19 Acres 29 Palms Hwy
- 66400 29 Palms Hwy
- 61638 La Jolla Dr
- 61529 Palm Vista Dr
- 61680 Valley View Dr
- 6896 Conejo Ave
- 61494 Sunburst Dr
- 61619 Palm Vista Dr
- 61610 Sunburst Dr
- 61494 El Reposo Cir
- 61562 El Reposo St
- 61509 Desert Air Rd
- 61519 Desert Air Rd
- 61482 El Reposo Cir
- 61457 El Reposo St
- 61503 El Reposo St
- 61515 El Reposo St
- 61497 El Reposo Cir
- 61472 El Reposo St
- 61527 Desert Air Rd
- 61481 El Reposo St
- 61471 El Reposo St
- 61550 El Reposo St
- 61496 Capilla Dr
- 61549 Desert Air Rd
- 61516 Capilla Dr
- 61484 Capilla Dr
- 61547 El Reposo St
- 61498 Desert Air Rd Unit 2