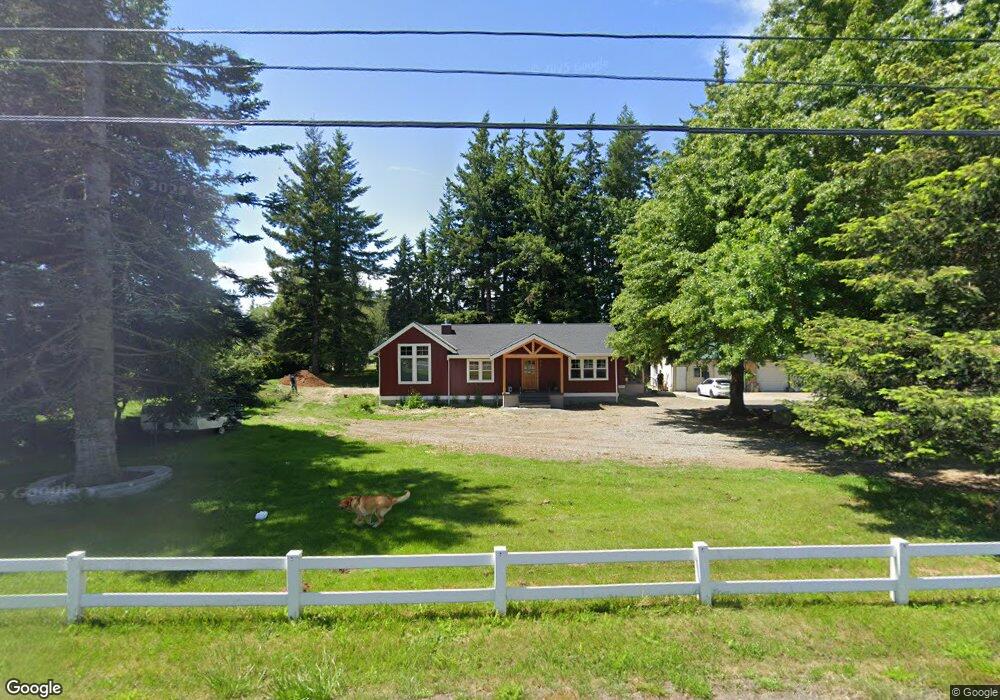
6151 Hannegan Rd Everson, WA 98247
Estimated Value: $589,000 - $767,000
3
Beds
3
Baths
1,947
Sq Ft
$344/Sq Ft
Est. Value
About This Home
This home is located at 6151 Hannegan Rd, Everson, WA 98247 and is currently estimated at $669,451, approximately $343 per square foot. 6151 Hannegan Rd is a home located in Whatcom County with nearby schools including Irene Reither Elementary School, Meridian Middle School, and Meridian High School.
Ownership History
Date
Name
Owned For
Owner Type
Purchase Details
Closed on
Aug 9, 2010
Sold by
Smit Albert A and Smith Laura
Bought by
Vander Veen Jason R and Vander Veen Darlene K
Current Estimated Value
Home Financials for this Owner
Home Financials are based on the most recent Mortgage that was taken out on this home.
Original Mortgage
$228,000
Outstanding Balance
$148,798
Interest Rate
4.52%
Mortgage Type
New Conventional
Estimated Equity
$520,653
Purchase Details
Closed on
Apr 28, 2004
Sold by
Harrell Anthony J and Harrell Shannon A
Bought by
Stauffer Laura
Purchase Details
Closed on
Mar 14, 2000
Sold by
Wasley Thomas M and Wasley Jane D
Bought by
Harrell Anthony J and Harrell Shannon A
Home Financials for this Owner
Home Financials are based on the most recent Mortgage that was taken out on this home.
Original Mortgage
$181,800
Interest Rate
8.27%
Mortgage Type
Purchase Money Mortgage
Create a Home Valuation Report for This Property
The Home Valuation Report is an in-depth analysis detailing your home's value as well as a comparison with similar homes in the area
Purchase History
| Date | Buyer | Sale Price | Title Company |
|---|---|---|---|
| Vander Veen Jason R | $285,280 | Chicago Title Insurance | |
| Stauffer Laura | $232,000 | Chicago Title Insurance | |
| Harrell Anthony J | $150,421 | First American Title Insuran |
Source: Public Records
Mortgage History
| Date | Status | Borrower | Loan Amount |
|---|---|---|---|
| Open | Vander Veen Jason R | $228,000 | |
| Previous Owner | Harrell Anthony J | $181,800 |
Source: Public Records
Tax History
| Year | Tax Paid | Tax Assessment Tax Assessment Total Assessment is a certain percentage of the fair market value that is determined by local assessors to be the total taxable value of land and additions on the property. | Land | Improvement |
|---|---|---|---|---|
| 2025 | $5,148 | $747,800 | $277,614 | $470,186 |
| 2024 | $4,512 | $584,597 | $261,900 | $322,697 |
| 2023 | $4,512 | $580,286 | $270,000 | $310,286 |
| 2022 | $3,689 | $444,386 | $185,570 | $258,816 |
| 2021 | $3,602 | $367,253 | $153,360 | $213,893 |
| 2020 | $3,298 | $327,908 | $136,930 | $190,978 |
| 2019 | $2,797 | $301,111 | $125,740 | $175,371 |
| 2018 | $3,154 | $279,247 | $116,610 | $162,637 |
| 2017 | $3,146 | $239,471 | $100,000 | $139,471 |
| 2016 | $3,035 | $253,041 | $88,752 | $164,289 |
| 2015 | $3,053 | $243,000 | $85,312 | $157,688 |
| 2014 | -- | $237,116 | $83,248 | $153,868 |
| 2013 | -- | $230,151 | $80,840 | $149,311 |
Source: Public Records
Map
Nearby Homes
- 6049 Medcalf Rd
- 5774 Denali Ln
- 5747 Denali Ln
- 5750 Denali Ln
- 5707 Denali Ln
- 740 Denali Ct
- 1375 Ten Mile Rd
- 1383 Ten Mile Rd
- 5700 Denali Ln
- 720 Denali Ct
- 739 Denali Ct
- 731 Denali Ct
- 725 Denali Ct
- 6743 La Bello Dr
- 6778 La Monte Dr
- 6849 Raspberry Dr
- 353 E Silverado Ct
- 351 W Silverado Ct
- 6917 Red Ridge Dr
- 858 E Smith Rd
- 6145 Hannegan Rd
- 6173 Hannegan Rd
- 6131 Hannegan Rd
- 6184 Hannegan Rd
- 888 E Hemmi Rd
- 860 E Hemmi Rd
- 946 E Hemmi Rd
- 6181 Hannegan Rd
- 832 E Hemmi Rd
- 6073 Hannegan Rd
- 929 E Hemmi Rd
- 816 E Hemmi Rd
- 6218 Hannegan Rd
- 6069 Hannegan Rd
- 6245 Hannegan Rd
- 993 E Hemmi Rd
- 1000 E Hemmi Rd
- 1012 E Hemmi Rd
- 941 Ten Mile Rd
Your Personal Tour Guide
Ask me questions while you tour the home.