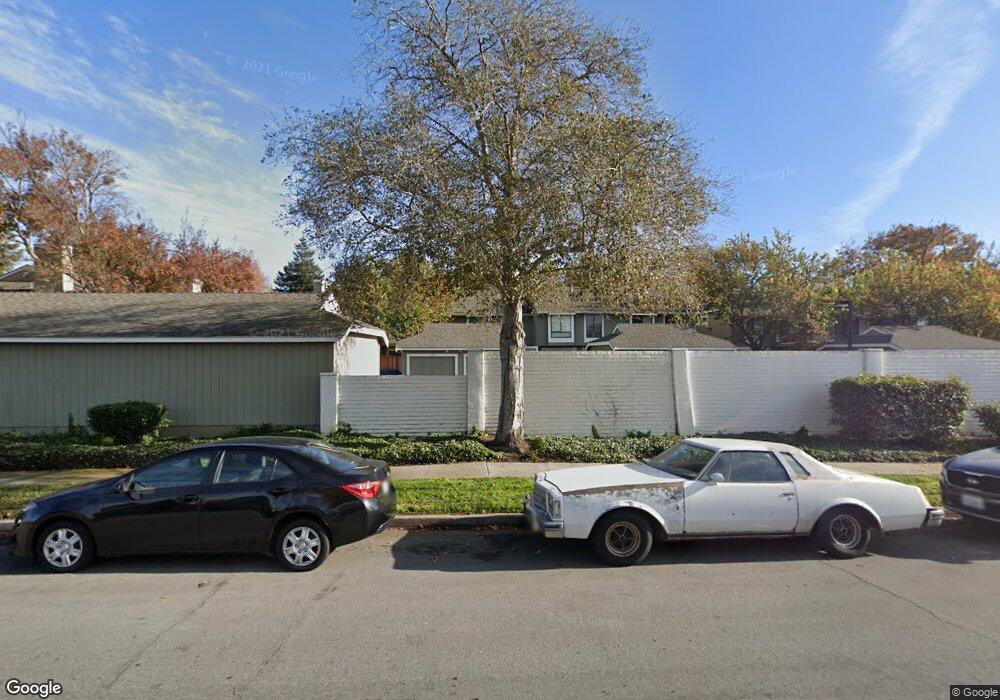
6159 Thornton Ave Unit C Newark, CA 94560
Estimated Value: $752,000 - $828,000
3
Beds
2
Baths
1,383
Sq Ft
$570/Sq Ft
Est. Value
About This Home
This home is located at 6159 Thornton Ave Unit C, Newark, CA 94560 and is currently estimated at $788,290, approximately $569 per square foot. 6159 Thornton Ave Unit C is a home located in Alameda County with nearby schools including Coyote Hills Elementary School, Newark Junior High School, and Newark Memorial High School.
Ownership History
Date
Name
Owned For
Owner Type
Purchase Details
Closed on
Jun 26, 2015
Sold by
Frankera Jay B and Felina Queeniever B
Bought by
Felina Queeniever B
Current Estimated Value
Home Financials for this Owner
Home Financials are based on the most recent Mortgage that was taken out on this home.
Original Mortgage
$241,000
Outstanding Balance
$187,589
Interest Rate
3.81%
Mortgage Type
New Conventional
Estimated Equity
$600,701
Purchase Details
Closed on
Mar 13, 2002
Sold by
Zhou Jin Lan and Lam Ricky
Bought by
Frankera Jay B and Felina Queeniever B
Home Financials for this Owner
Home Financials are based on the most recent Mortgage that was taken out on this home.
Original Mortgage
$259,040
Interest Rate
6.62%
Purchase Details
Closed on
Sep 8, 1999
Sold by
Henretty Alexander and Henretty Michaela A
Bought by
Lam Ricky and Zhou Jin Lan
Home Financials for this Owner
Home Financials are based on the most recent Mortgage that was taken out on this home.
Original Mortgage
$164,100
Interest Rate
7.66%
Mortgage Type
Balloon
Create a Home Valuation Report for This Property
The Home Valuation Report is an in-depth analysis detailing your home's value as well as a comparison with similar homes in the area
Home Values in the Area
Average Home Value in this Area
Purchase History
| Date | Buyer | Sale Price | Title Company |
|---|---|---|---|
| Felina Queeniever B | $121,000 | North American Title Co Inc | |
| Frankera Jay B | $324,000 | Chicago Title Co | |
| Lam Ricky | $219,000 | Old Republic Title Company |
Source: Public Records
Mortgage History
| Date | Status | Borrower | Loan Amount |
|---|---|---|---|
| Open | Felina Queeniever B | $241,000 | |
| Closed | Frankera Jay B | $259,040 | |
| Previous Owner | Lam Ricky | $164,100 | |
| Closed | Lam Ricky | $43,750 | |
| Closed | Frankera Jay B | $32,380 |
Source: Public Records
Tax History Compared to Growth
Tax History
| Year | Tax Paid | Tax Assessment Tax Assessment Total Assessment is a certain percentage of the fair market value that is determined by local assessors to be the total taxable value of land and additions on the property. | Land | Improvement |
|---|---|---|---|---|
| 2025 | $6,540 | $520,592 | $158,322 | $369,270 |
| 2024 | $6,540 | $510,249 | $155,218 | $362,031 |
| 2023 | $6,358 | $507,109 | $152,175 | $354,934 |
| 2022 | $6,272 | $490,165 | $149,191 | $347,974 |
| 2021 | $6,121 | $480,419 | $146,266 | $341,153 |
| 2020 | $6,015 | $482,423 | $144,767 | $337,656 |
| 2019 | $5,928 | $472,966 | $141,929 | $331,037 |
| 2018 | $5,838 | $463,694 | $139,147 | $324,547 |
| 2017 | $5,689 | $454,604 | $136,419 | $318,185 |
| 2016 | $5,626 | $445,692 | $133,745 | $311,947 |
| 2015 | $5,113 | $397,998 | $119,473 | $278,525 |
| 2014 | $4,978 | $390,204 | $117,133 | $273,071 |
Source: Public Records
Map
Nearby Homes
- 6153 Thornton Ave Unit D
- 6278 Dairy Ave
- 36593 Leone St
- 6364 Noel Ave
- 6433 Thornton Ave
- 36976 Mulberry St
- 6198 Civic Terrace Ave Unit A
- 36523 Cherry St
- 36702 Olive St
- 36535 Mulberry St
- 6025 Radcliffe Ave
- 5879 Caleb Ct
- 6176 Thomas Ave
- 37136 Magnolia St
- 36466 Haley St
- 36563 Beutke Dr
- 37282 Magnolia St
- 5447 Saint Mark Ave
- 5315 Port Sailwood Dr Unit 7
- 37643 Crocus Ct
- 6159 Thornton Ave Unit A
- 6159 Thornton Ave Unit B
- 6159 Thornton Ave Unit D
- 6159 Thornton Ave Unit E
- 6137 Thornton Ave
- 6137 Thornton Ave Unit A
- 6137 Thornton Ave Unit B
- 6137 Thornton Ave Unit C
- 6153 Thornton Ave Unit A
- 6153 Thornton Ave Unit B
- 6153 Thornton Ave Unit C
- 36887 Newark Blvd Unit D
- 36887 Newark Blvd Unit C
- 36887 Newark Blvd Unit B
- 36887 Newark Blvd Unit A
- 36879 Newark Blvd Unit B
- 36879 Newark Blvd Unit A
- 36871 Newark Blvd Unit E
- 36871 Newark Blvd Unit D
- 36871 Newark Blvd Unit C