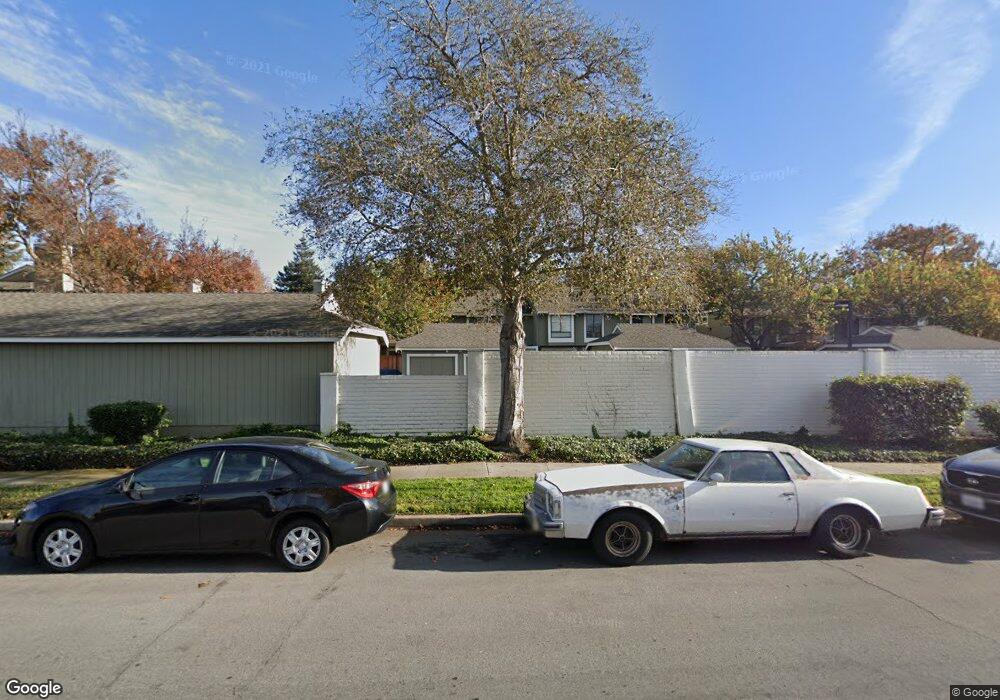
6159 Thornton Ave Unit D Newark, CA 94560
Estimated Value: $728,277 - $785,000
3
Beds
2
Baths
1,383
Sq Ft
$552/Sq Ft
Est. Value
About This Home
This home is located at 6159 Thornton Ave Unit D, Newark, CA 94560 and is currently estimated at $763,069, approximately $551 per square foot. 6159 Thornton Ave Unit D is a home located in Alameda County with nearby schools including Coyote Hills Elementary School, Newark Junior High School, and Newark Memorial High School.
Ownership History
Date
Name
Owned For
Owner Type
Purchase Details
Closed on
Jan 14, 2002
Sold by
Gipson Antwan
Bought by
Gipson Antwan M
Current Estimated Value
Home Financials for this Owner
Home Financials are based on the most recent Mortgage that was taken out on this home.
Original Mortgage
$275,000
Outstanding Balance
$112,937
Interest Rate
7.11%
Estimated Equity
$650,132
Purchase Details
Closed on
Oct 27, 2000
Sold by
Gipson Christe
Bought by
Gipson Antwan
Home Financials for this Owner
Home Financials are based on the most recent Mortgage that was taken out on this home.
Original Mortgage
$236,250
Interest Rate
7.89%
Purchase Details
Closed on
Oct 16, 2000
Sold by
Collord Grant S and Collord Alethea G
Bought by
Gipson Aniwan
Home Financials for this Owner
Home Financials are based on the most recent Mortgage that was taken out on this home.
Original Mortgage
$236,250
Interest Rate
7.89%
Create a Home Valuation Report for This Property
The Home Valuation Report is an in-depth analysis detailing your home's value as well as a comparison with similar homes in the area
Home Values in the Area
Average Home Value in this Area
Purchase History
| Date | Buyer | Sale Price | Title Company |
|---|---|---|---|
| Gipson Antwan M | -- | -- | |
| Gipson Antwan | -- | Old Republic Title Company | |
| Gipson Aniwan | $315,000 | Old Republic Title Company |
Source: Public Records
Mortgage History
| Date | Status | Borrower | Loan Amount |
|---|---|---|---|
| Open | Gipson Antwan M | $275,000 | |
| Closed | Gipson Aniwan | $236,250 | |
| Closed | Gipson Aniwan | $63,000 | |
| Closed | Gipson Antwan M | $35,500 |
Source: Public Records
Tax History Compared to Growth
Tax History
| Year | Tax Paid | Tax Assessment Tax Assessment Total Assessment is a certain percentage of the fair market value that is determined by local assessors to be the total taxable value of land and additions on the property. | Land | Improvement |
|---|---|---|---|---|
| 2025 | $5,855 | $460,085 | $140,125 | $326,960 |
| 2024 | $5,855 | $450,928 | $137,378 | $320,550 |
| 2023 | $5,690 | $448,950 | $134,685 | $314,265 |
| 2022 | $5,609 | $433,150 | $132,045 | $308,105 |
| 2021 | $5,475 | $424,520 | $129,456 | $302,064 |
| 2020 | $5,370 | $427,095 | $128,128 | $298,967 |
| 2019 | $5,293 | $418,722 | $125,616 | $293,106 |
| 2018 | $5,212 | $410,514 | $123,154 | $287,360 |
| 2017 | $5,078 | $402,466 | $120,740 | $281,726 |
| 2016 | $5,020 | $394,577 | $118,373 | $276,204 |
| 2015 | $5,001 | $388,652 | $116,595 | $272,057 |
| 2014 | $4,869 | $381,041 | $114,312 | $266,729 |
Source: Public Records
Map
Nearby Homes
- 6245 Thornton Ave
- 6328 Zulmida Ave
- 36391 Cherry St
- 36563 Beutke Dr
- 6133 Broadway Ave
- 36621 Beutke Dr
- 36255 Casey Ct
- 6417/6433 Thornton Ave
- 5311 Port Sailwood Dr
- 36184 Toulouse St
- 5859 Central Ave
- 35875 Argonne St
- 36167 Toulouse St
- 37164 Saint Christopher St
- 6449 Cedar Blvd
- 7728 Hazelnut Dr
- 37768 Rockspray St
- 6257 Honeysuckle Dr
- 7843 Railroad Ave
- 6181 Robertson Ave
- 6159 Thornton Ave Unit A
- 6159 Thornton Ave Unit B
- 6159 Thornton Ave Unit C
- 6159 Thornton Ave Unit E
- 6137 Thornton Ave
- 6137 Thornton Ave Unit A
- 6137 Thornton Ave Unit B
- 6137 Thornton Ave Unit C
- 6153 Thornton Ave Unit A
- 6153 Thornton Ave Unit B
- 6153 Thornton Ave Unit C
- 36887 Newark Blvd Unit D
- 36887 Newark Blvd Unit C
- 36887 Newark Blvd Unit B
- 36887 Newark Blvd Unit A
- 36879 Newark Blvd Unit B
- 36879 Newark Blvd Unit A
- 36871 Newark Blvd Unit E
- 36871 Newark Blvd Unit D
- 36871 Newark Blvd Unit C