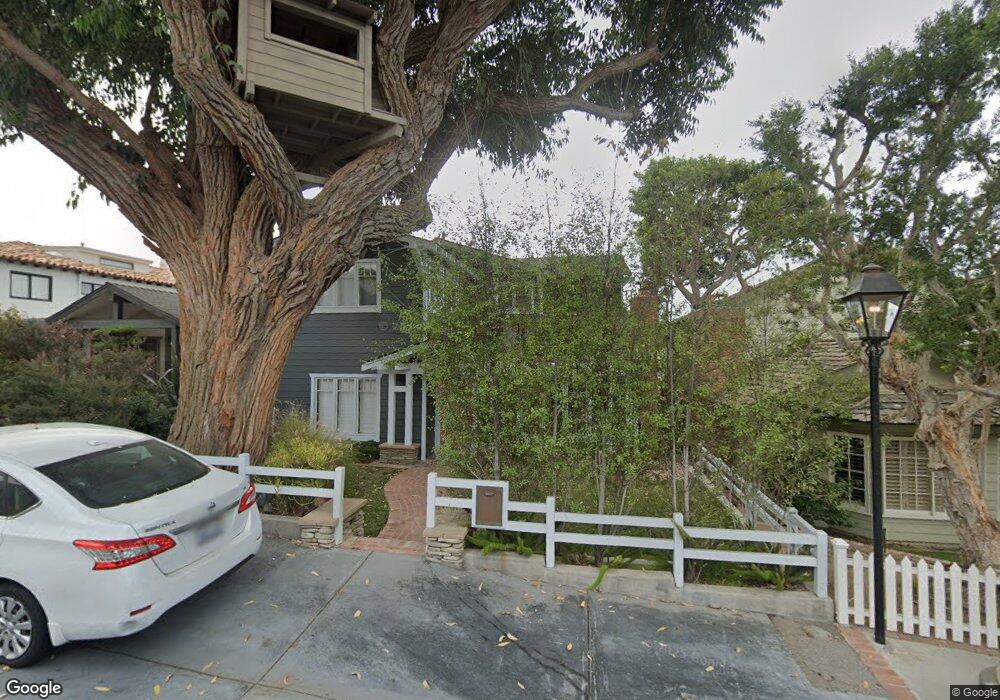
616 31st St Manhattan Beach, CA 90266
Estimated Value: $3,293,390 - $4,214,000
4
Beds
3
Baths
2,594
Sq Ft
$1,447/Sq Ft
Est. Value
About This Home
This home is located at 616 31st St, Manhattan Beach, CA 90266 and is currently estimated at $3,752,848, approximately $1,446 per square foot. 616 31st St is a home located in Los Angeles County with nearby schools including Grand View Elementary School, Manhattan Beach Middle School, and Mira Costa High School.
Ownership History
Date
Name
Owned For
Owner Type
Purchase Details
Closed on
Feb 9, 2022
Sold by
Harris Dorian B
Bought by
Dorian B Harris Revocable Trust
Current Estimated Value
Purchase Details
Closed on
May 7, 2020
Sold by
Robert M Huberman Revocable Trust and Robert M Huberman Revocable Tr
Bought by
Dorian B Harris Revocable Trust and Harris
Purchase Details
Closed on
Jun 16, 2014
Sold by
Harris Dorian
Bought by
Harris Dorian B and Dorian B Harris Revocable Trus
Purchase Details
Closed on
Jun 5, 2014
Sold by
Huberman Robert
Bought by
Huberman Robert M and Robert M Huberman Revocable Tr
Purchase Details
Closed on
Jul 15, 1993
Sold by
First Wisconsin Trust Company
Bought by
Huberman Robert and Harris Dorian
Home Financials for this Owner
Home Financials are based on the most recent Mortgage that was taken out on this home.
Original Mortgage
$280,000
Interest Rate
7.16%
Create a Home Valuation Report for This Property
The Home Valuation Report is an in-depth analysis detailing your home's value as well as a comparison with similar homes in the area
Home Values in the Area
Average Home Value in this Area
Purchase History
| Date | Buyer | Sale Price | Title Company |
|---|---|---|---|
| Dorian B Harris Revocable Trust | -- | Jones Margaret A | |
| Dorian B Harris Revocable Trust | -- | None Listed On Document | |
| Harris Dorian B | -- | None Available | |
| Huberman Robert M | -- | None Available | |
| Huberman Robert | $350,000 | Southland Title Corporation |
Source: Public Records
Mortgage History
| Date | Status | Borrower | Loan Amount |
|---|---|---|---|
| Previous Owner | Huberman Robert | $280,000 |
Source: Public Records
Tax History Compared to Growth
Tax History
| Year | Tax Paid | Tax Assessment Tax Assessment Total Assessment is a certain percentage of the fair market value that is determined by local assessors to be the total taxable value of land and additions on the property. | Land | Improvement |
|---|---|---|---|---|
| 2025 | $19,167 | $1,706,371 | $1,405,276 | $301,095 |
| 2024 | $19,167 | $1,672,914 | $1,377,722 | $295,192 |
| 2023 | $18,633 | $1,640,112 | $1,350,708 | $289,404 |
| 2022 | $8,388 | $717,971 | $448,456 | $269,515 |
| 2021 | $8,276 | $703,894 | $439,663 | $264,231 |
| 2020 | $8,199 | $696,677 | $435,155 | $261,522 |
| 2019 | $8,056 | $683,018 | $426,623 | $256,395 |
| 2018 | $7,861 | $669,626 | $418,258 | $251,368 |
| 2016 | $7,371 | $643,625 | $402,017 | $241,608 |
| 2015 | $7,222 | $633,958 | $395,979 | $237,979 |
| 2014 | $7,130 | $621,541 | $388,223 | $233,318 |
Source: Public Records
Map
Nearby Homes