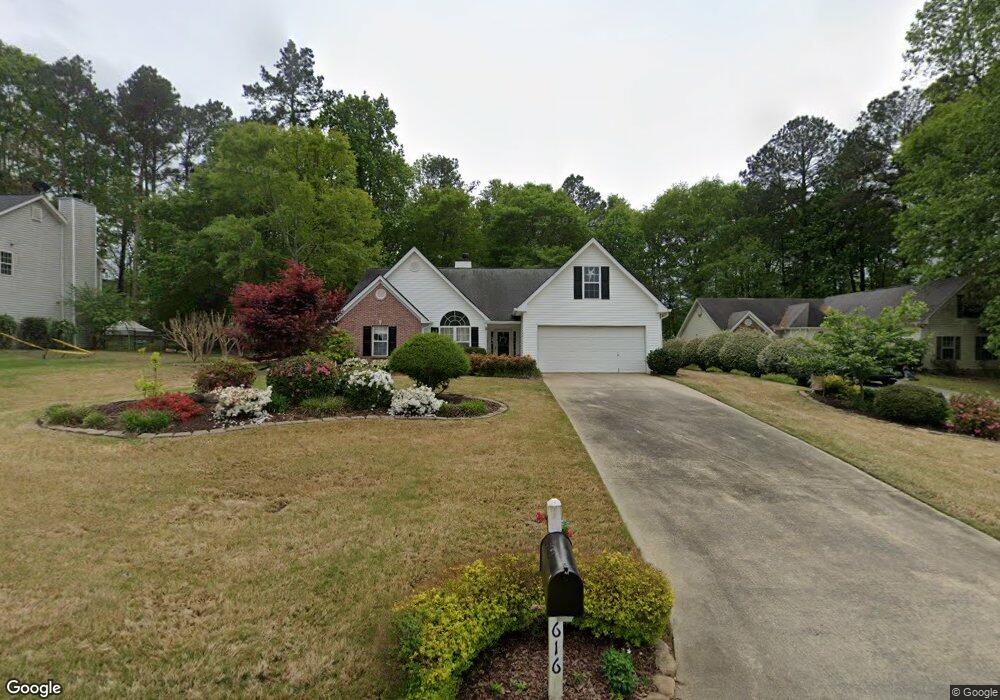
616 Bridle Creek Dr Bethlehem, GA 30620
Estimated Value: $311,000 - $350,000
3
Beds
2
Baths
1,800
Sq Ft
$186/Sq Ft
Est. Value
About This Home
This home is located at 616 Bridle Creek Dr, Bethlehem, GA 30620 and is currently estimated at $334,487, approximately $185 per square foot. 616 Bridle Creek Dr is a home located in Barrow County with nearby schools including Yargo Elementary School, Haymon-Morris Middle School, and Apalachee High School.
Ownership History
Date
Name
Owned For
Owner Type
Purchase Details
Closed on
Jul 12, 2001
Sold by
Sec Of Hud
Bought by
Hartman Sharon
Current Estimated Value
Home Financials for this Owner
Home Financials are based on the most recent Mortgage that was taken out on this home.
Original Mortgage
$82,000
Outstanding Balance
$31,647
Interest Rate
7.16%
Mortgage Type
New Conventional
Estimated Equity
$302,840
Purchase Details
Closed on
Apr 3, 2001
Sold by
Gmac Mortgage Corp
Bought by
Secretary Of Housing
Purchase Details
Closed on
Feb 29, 2000
Sold by
Taylored Homes Inc
Bought by
Krull Roberta S and Krull Christopher J
Home Financials for this Owner
Home Financials are based on the most recent Mortgage that was taken out on this home.
Original Mortgage
$133,794
Interest Rate
8.3%
Mortgage Type
FHA
Purchase Details
Closed on
Aug 5, 1999
Sold by
Belmont Neighborhood
Bought by
Taylored Homes Inc
Create a Home Valuation Report for This Property
The Home Valuation Report is an in-depth analysis detailing your home's value as well as a comparison with similar homes in the area
Home Values in the Area
Average Home Value in this Area
Purchase History
| Date | Buyer | Sale Price | Title Company |
|---|---|---|---|
| Hartman Sharon | -- | -- | |
| Secretary Of Housing | -- | -- | |
| Krull Roberta S | $134,900 | -- | |
| Taylored Homes Inc | $24,500 | -- |
Source: Public Records
Mortgage History
| Date | Status | Borrower | Loan Amount |
|---|---|---|---|
| Open | Hartman Sharon | $82,000 | |
| Previous Owner | Krull Roberta S | $133,794 |
Source: Public Records
Tax History Compared to Growth
Tax History
| Year | Tax Paid | Tax Assessment Tax Assessment Total Assessment is a certain percentage of the fair market value that is determined by local assessors to be the total taxable value of land and additions on the property. | Land | Improvement |
|---|---|---|---|---|
| 2024 | $1,496 | $113,220 | $24,000 | $89,220 |
| 2023 | $1,102 | $113,620 | $24,000 | $89,620 |
| 2022 | $933 | $85,542 | $16,000 | $69,542 |
| 2021 | $2,156 | $72,578 | $16,000 | $56,578 |
| 2020 | $2,157 | $72,578 | $16,000 | $56,578 |
| 2019 | $1,931 | $63,936 | $16,000 | $47,936 |
| 2018 | $1,834 | $61,536 | $13,600 | $47,936 |
| 2017 | $1,372 | $47,116 | $13,600 | $33,516 |
| 2016 | $1,374 | $47,506 | $13,600 | $33,906 |
| 2015 | $1,391 | $47,895 | $13,600 | $34,295 |
| 2014 | $1,210 | $41,545 | $6,860 | $34,685 |
| 2013 | -- | $39,507 | $6,860 | $32,647 |
Source: Public Records
Map
Nearby Homes
- 1129 Loganville Hwy
- 1164 Otis Dr
- 1111 Otis Dr
- 1024 Lyndhurst Ln
- 209 Angie Way
- 303 Ron Dr
- 1441 Dillard Heights Dr
- 704 Newnham Walk
- 934 Beaver Hill Dr
- The Barnes Plan at River Meadows
- The Paisley Plan at River Meadows
- The Rose II Plan at River Meadows
- The Logan Plan at River Meadows
- 738 Worth Ct
- 73 Silverleaf Trail
- 286 Meadows Dr
- 724 Westbury Dr
- 64 Silverleaf Trail
- 720 Westbury Ct
- 637 Sleeping Meadow Ln
- 614 Bridle Creek Dr
- 618 Bridle Creek Dr
- 0 Bridle Creek Dr Unit 7113490
- 0 Bridle Creek Dr Unit 7038322
- 0 Bridle Creek Dr Unit 3183169
- 612 Bridle Creek Dr
- 716 Cliffside Dr
- 716 Cliffside Dr Unit 8
- 727 Crestview Dr
- 619 Bridle Creek Dr
- 615 Bridle Creek Dr
- 610 Bridle Creek Dr
- 714 Cliffside Dr
- 613 Bridle Creek Dr
- 621 Bridle Creek Dr
- 611 Bridle Creek Dr
- 725 Crestview Dr
- 620 Bridle Creek Dr
- 608 Bridle Creek Dr
- 723 Crestview Dr