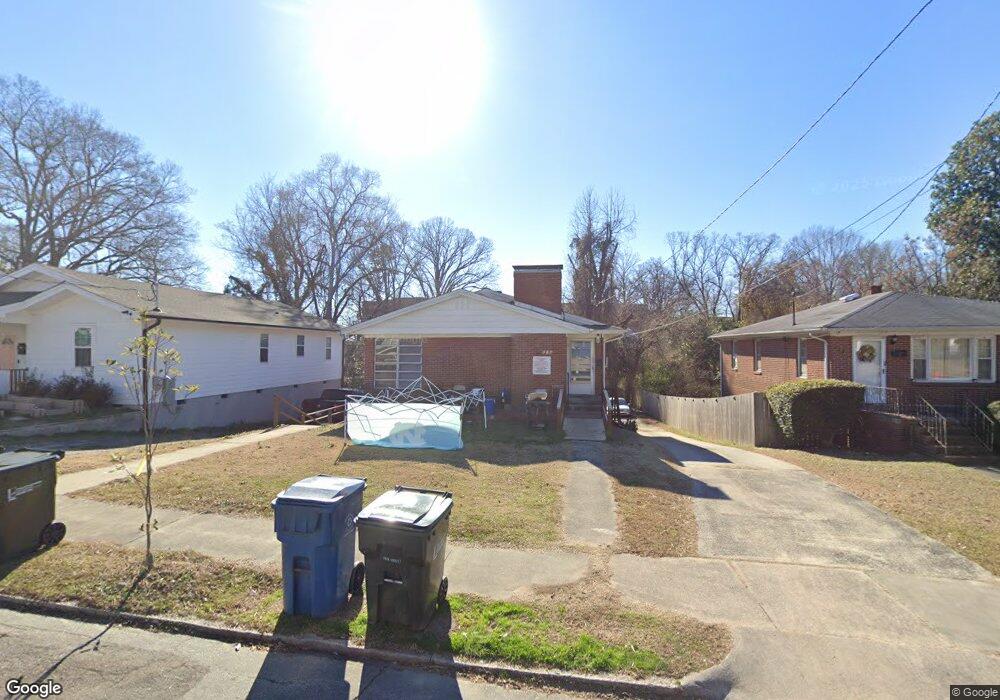
616 Dunbar St Durham, NC 27701
Hayti District NeighborhoodEstimated Value: $313,000 - $371,000
3
Beds
2
Baths
2,448
Sq Ft
$137/Sq Ft
Est. Value
About This Home
This home is located at 616 Dunbar St, Durham, NC 27701 and is currently estimated at $336,167, approximately $137 per square foot. 616 Dunbar St is a home located in Durham County with nearby schools including Fayetteville Street Elementary School, James E. Shepard Middle School, and Hillside High School.
Ownership History
Date
Name
Owned For
Owner Type
Purchase Details
Closed on
Mar 31, 2025
Sold by
Dayal Satinder and Dayal Rajender
Bought by
Dunbar Residential Llc
Current Estimated Value
Purchase Details
Closed on
Dec 20, 2016
Sold by
Watson Odell
Bought by
Dayal Satinder
Purchase Details
Closed on
Jan 28, 2015
Sold by
Watson Odell A and Watson Annette O
Bought by
Watson Odell A and Watson Annette O
Create a Home Valuation Report for This Property
The Home Valuation Report is an in-depth analysis detailing your home's value as well as a comparison with similar homes in the area
Home Values in the Area
Average Home Value in this Area
Purchase History
| Date | Buyer | Sale Price | Title Company |
|---|---|---|---|
| Dunbar Residential Llc | -- | None Listed On Document | |
| Dunbar Residential Llc | -- | None Listed On Document | |
| Dayal Satinder | $70,000 | -- | |
| Watson Odell A | -- | None Available |
Source: Public Records
Tax History
| Year | Tax Paid | Tax Assessment Tax Assessment Total Assessment is a certain percentage of the fair market value that is determined by local assessors to be the total taxable value of land and additions on the property. | Land | Improvement |
|---|---|---|---|---|
| 2025 | $2,251 | $227,065 | $102,375 | $124,690 |
| 2024 | $1,003 | $71,922 | $23,440 | $48,482 |
| 2023 | $921 | $71,922 | $23,440 | $48,482 |
| 2022 | $921 | $71,922 | $23,440 | $48,482 |
| 2021 | $916 | $71,922 | $23,440 | $48,482 |
| 2020 | $895 | $71,922 | $23,440 | $48,482 |
| 2019 | $895 | $71,922 | $23,440 | $48,482 |
| 2018 | $1,189 | $87,669 | $11,720 | $75,949 |
| 2017 | $1,017 | $75,515 | $11,720 | $63,795 |
| 2016 | $983 | $75,515 | $11,720 | $63,795 |
| 2015 | $1,495 | $108,025 | $17,138 | $90,887 |
| 2014 | $1,495 | $108,025 | $17,138 | $90,887 |
Source: Public Records
Map
Nearby Homes
- 602 Dunbar St
- 1609 Lincoln St
- 1608 Fayetteville St
- 803 A Dupree St
- 803 B Dupree St
- 802 Cox Ave
- 809 Dupree St
- 401 Moline St
- 701 Linwood Ave
- 1222 Merrick St
- 906 Price Ave
- 1203 Avery St
- 200 Bern St
- 111 Dunstan Ave
- 311 Burnette St
- 909 S Alston Ave
- 903 Dayton St
- 315 E Umstead St
- 608 E Umstead St
- 1306 Rosewood St
Your Personal Tour Guide
Ask me questions while you tour the home.