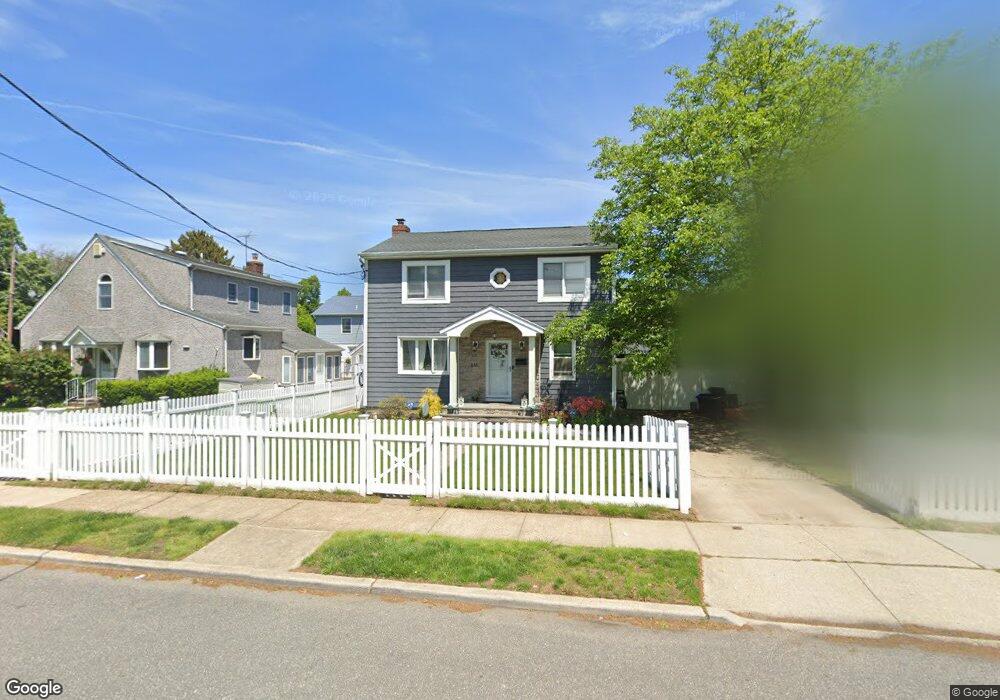
616 Fenworth Blvd Franklin Square, NY 11010
Estimated Value: $830,340 - $976,000
4
Beds
3
Baths
1,680
Sq Ft
$538/Sq Ft
Est. Value
About This Home
This home is located at 616 Fenworth Blvd, Franklin Square, NY 11010 and is currently estimated at $903,170, approximately $537 per square foot. 616 Fenworth Blvd is a home located in Nassau County with nearby schools including Hebrew Academy of Nassau County (HANC).
Ownership History
Date
Name
Owned For
Owner Type
Purchase Details
Closed on
Oct 28, 2019
Sold by
Smyth Daniel and Smyth Natasha
Bought by
Travascio Gonzalo and Jure Maria Yanina
Current Estimated Value
Home Financials for this Owner
Home Financials are based on the most recent Mortgage that was taken out on this home.
Original Mortgage
$548,000
Outstanding Balance
$483,055
Interest Rate
3.7%
Mortgage Type
New Conventional
Estimated Equity
$420,115
Purchase Details
Closed on
Feb 29, 2016
Sold by
Flood Edmond J and Flood Gina
Bought by
Smyth Daniel and Smyth Natasha
Home Financials for this Owner
Home Financials are based on the most recent Mortgage that was taken out on this home.
Original Mortgage
$464,000
Interest Rate
3.79%
Mortgage Type
New Conventional
Purchase Details
Closed on
Dec 17, 2008
Sold by
Schumacher George
Bought by
Reda Gina
Purchase Details
Closed on
Aug 29, 1997
Sold by
Trust Richard W Greene R Evoc
Bought by
Schumacher George L and Schumacher George L
Purchase Details
Closed on
Oct 5, 1996
Create a Home Valuation Report for This Property
The Home Valuation Report is an in-depth analysis detailing your home's value as well as a comparison with similar homes in the area
Home Values in the Area
Average Home Value in this Area
Purchase History
| Date | Buyer | Sale Price | Title Company |
|---|---|---|---|
| Travascio Gonzalo | $685,000 | Complete Title Services | |
| Smyth Daniel | $580,000 | None Available | |
| Reda Gina | $460,000 | -- | |
| Schumacher George L | $185,000 | -- | |
| -- | -- | -- |
Source: Public Records
Mortgage History
| Date | Status | Borrower | Loan Amount |
|---|---|---|---|
| Open | Travascio Gonzalo | $548,000 | |
| Previous Owner | Smyth Daniel | $464,000 |
Source: Public Records
Tax History Compared to Growth
Tax History
| Year | Tax Paid | Tax Assessment Tax Assessment Total Assessment is a certain percentage of the fair market value that is determined by local assessors to be the total taxable value of land and additions on the property. | Land | Improvement |
|---|---|---|---|---|
| 2025 | $11,894 | $544 | $266 | $278 |
| 2024 | $4,668 | $542 | $265 | $277 |
| 2023 | $11,794 | $575 | $283 | $292 |
| 2022 | $11,794 | $575 | $283 | $292 |
| 2021 | $14,706 | $565 | $278 | $287 |
| 2020 | $10,754 | $610 | $400 | $210 |
| 2019 | $3,274 | $584 | $400 | $184 |
| 2018 | $3,105 | $584 | $0 | $0 |
| 2017 | $4,122 | $620 | $377 | $243 |
| 2016 | $7,276 | $657 | $354 | $303 |
| 2015 | $3,294 | $693 | $374 | $319 |
| 2014 | $3,294 | $693 | $374 | $319 |
| 2013 | $3,296 | $742 | $400 | $342 |
Source: Public Records
Map
Nearby Homes
- 594 Fenworth Blvd
- 149 Rule St
- 198 Guildford Ct
- 231 Dogwood Ave
- 279 Semton Blvd
- 56 Fendale St
- 676 Sobo Ave
- 474 Roy St
- 249 Grange St
- 144 Rintin St
- 126 Oakland Ave
- 19 Richard St
- 303 Nassau Blvd
- 190 Commonwealth St
- 576 Western Park Dr
- 350 Paul Place
- 715 Iris St
- 31 Claflin Blvd
- 109 Caroline Ave
- 124 Kilburn Rd S