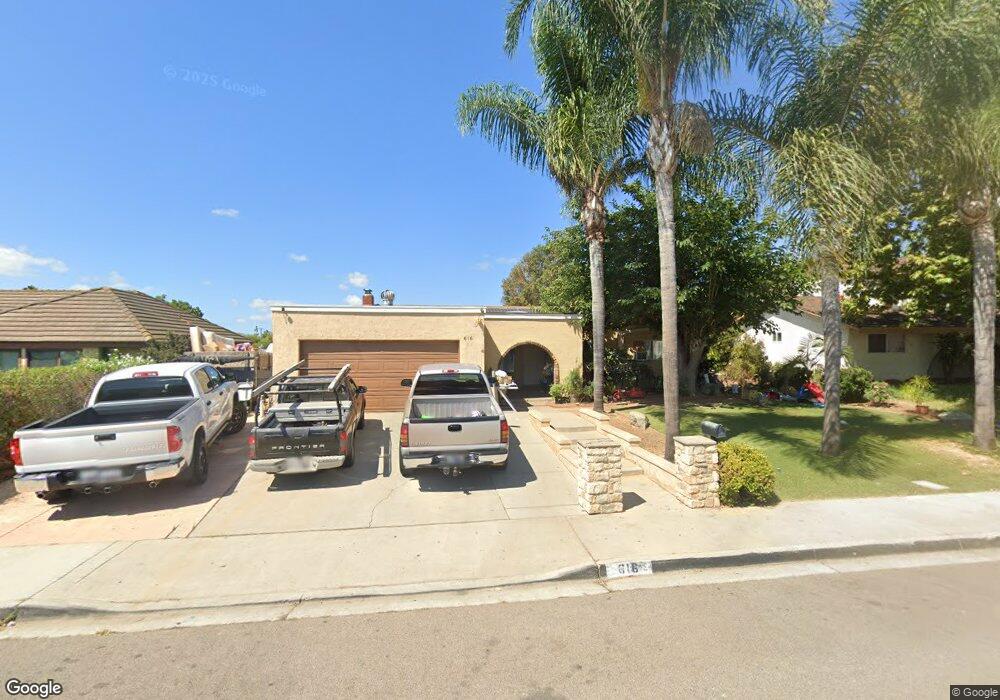
616 Lancer Park Ave San Marcos, CA 92069
Estimated Value: $889,000 - $1,000,000
4
Beds
2
Baths
1,718
Sq Ft
$542/Sq Ft
Est. Value
About This Home
This home is located at 616 Lancer Park Ave, San Marcos, CA 92069 and is currently estimated at $931,021, approximately $541 per square foot. 616 Lancer Park Ave is a home located in San Diego County with nearby schools including Richland Elementary School, Woodland Park Middle School, and Mission Hills High School.
Ownership History
Date
Name
Owned For
Owner Type
Purchase Details
Closed on
Mar 6, 2006
Sold by
Bazan Sofia
Bought by
Gutierrez Agustin
Current Estimated Value
Home Financials for this Owner
Home Financials are based on the most recent Mortgage that was taken out on this home.
Original Mortgage
$108,000
Outstanding Balance
$60,712
Interest Rate
6.08%
Mortgage Type
Credit Line Revolving
Estimated Equity
$870,309
Purchase Details
Closed on
Feb 21, 2006
Sold by
Vanes Paul C and Van Es Nanette M
Bought by
Gutierrez Agustin
Home Financials for this Owner
Home Financials are based on the most recent Mortgage that was taken out on this home.
Original Mortgage
$108,000
Outstanding Balance
$60,712
Interest Rate
6.08%
Mortgage Type
Credit Line Revolving
Estimated Equity
$870,309
Purchase Details
Closed on
Jul 17, 2001
Sold by
Vanes Paul C
Bought by
Vanes Paul C and Vanes Nanette M
Purchase Details
Closed on
Feb 27, 2001
Sold by
Vanes Frans A Sr Tr and Charles Paul
Bought by
Vanes Paul Charles
Purchase Details
Closed on
Sep 9, 1983
Create a Home Valuation Report for This Property
The Home Valuation Report is an in-depth analysis detailing your home's value as well as a comparison with similar homes in the area
Home Values in the Area
Average Home Value in this Area
Purchase History
| Date | Buyer | Sale Price | Title Company |
|---|---|---|---|
| Gutierrez Agustin | -- | First American Title | |
| Gutierrez Agustin | $540,000 | First American Title | |
| Vanes Paul C | -- | -- | |
| Vanes Paul Charles | -- | -- | |
| -- | $90,000 | -- |
Source: Public Records
Mortgage History
| Date | Status | Borrower | Loan Amount |
|---|---|---|---|
| Open | Gutierrez Agustin | $108,000 | |
| Open | Gutierrez Agustin | $432,000 |
Source: Public Records
Tax History Compared to Growth
Tax History
| Year | Tax Paid | Tax Assessment Tax Assessment Total Assessment is a certain percentage of the fair market value that is determined by local assessors to be the total taxable value of land and additions on the property. | Land | Improvement |
|---|---|---|---|---|
| 2025 | $8,065 | $742,001 | $512,460 | $229,541 |
| 2024 | $8,065 | $727,453 | $502,412 | $225,041 |
| 2023 | $7,916 | $713,190 | $492,561 | $220,629 |
| 2022 | $7,150 | $640,000 | $291,000 | $349,000 |
| 2021 | $6,614 | $590,000 | $269,000 | $321,000 |
| 2020 | $5,949 | $530,000 | $242,000 | $288,000 |
| 2019 | $5,887 | $520,000 | $238,000 | $282,000 |
| 2018 | $5,480 | $490,000 | $225,000 | $265,000 |
| 2017 | $133 | $473,500 | $215,000 | $258,500 |
| 2016 | $5,281 | $470,000 | $215,000 | $255,000 |
| 2015 | $4,557 | $405,000 | $186,000 | $219,000 |
| 2014 | $4,540 | $405,000 | $186,000 | $219,000 |
Source: Public Records
Map
Nearby Homes
- 1477 Glen Avon Dr
- 1524 Brook Rd
- 639 Butterwood Ave
- 909 Lacebark St
- 1401 W El Norte Pkwy Unit SPC 309
- 1401 W El Norte Pkwy Unit 145
- 1401 El Norte Pkwy Unit SPC 174
- 1401 El Norte Pkwy Unit SPC 326
- 1401 El Norte Pkwy Unit 34
- 1401 El Norte Pkwy Unit 282
- 1401 El Norte Pkwy Unit 60
- 1401 El Norte Pkwy Unit 145
- 1401 El Norte Pkwy Unit SPC 237
- 1120 Grape St
- 1609 Desert Glen
- 213 Woodland Pkwy Unit 210
- 227 Woodland Pkwy Unit 163
- 275 Richland Rd
- 214 Woodland Pkwy Unit 206
- 1708 Woodbridge Rd
- 608 Lancer Park Ave
- 624 Lancer Park Ave
- 600 Lancer Park Ave
- 632 Lancer Park Ave
- 1279 Orlando St
- 1280 Rock Springs Rd
- 640 Lancer Park Ave
- 1282 Orlando St
- 1301 Orlando St
- 1300 Rock Springs Rd
- 652 Lancer Park Ave
- 1302 Orlando St
- 1297 Mcclelland St
- 1241 Rock Springs Rd
- 1237 Rock Springs Rd
- 1311 Orlando St
- 1301 Mcclelland St
- 664 Lancer Park Ave
- 1233 Rock Springs Rd
- 1312 Rock Springs Rd