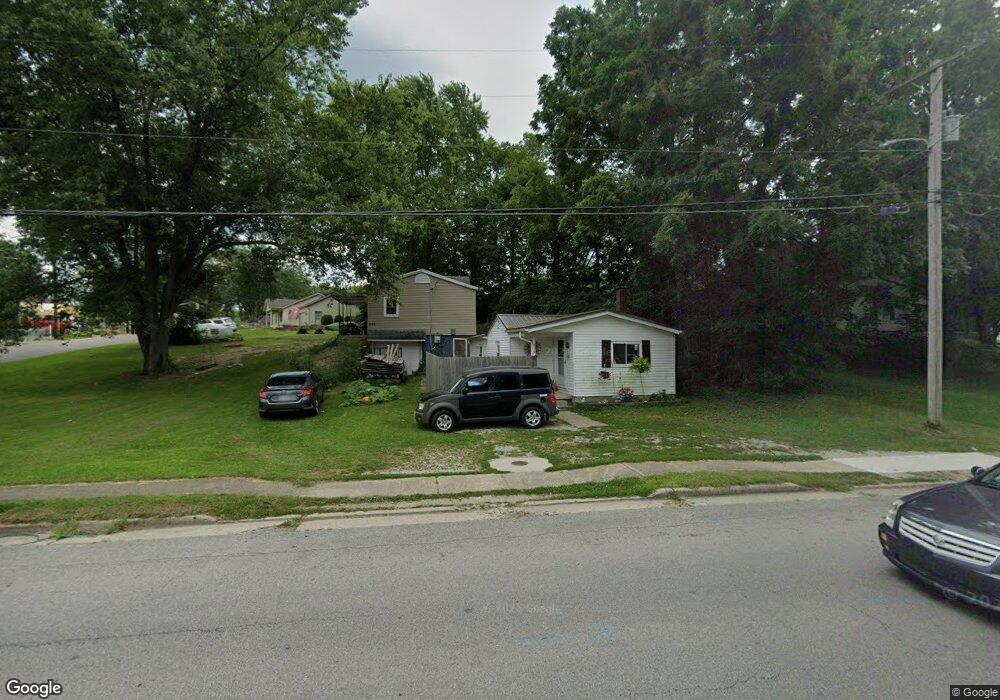
616 Maxwell Place Sidney, OH 45365
Estimated Value: $117,000 - $145,000
3
Beds
1
Bath
1,408
Sq Ft
$94/Sq Ft
Est. Value
About This Home
This home is located at 616 Maxwell Place, Sidney, OH 45365 and is currently estimated at $132,999, approximately $94 per square foot. 616 Maxwell Place is a home located in Shelby County with nearby schools including Sidney High School, Holy Angels Catholic School, and Christian Academy Schools.
Ownership History
Date
Name
Owned For
Owner Type
Purchase Details
Closed on
Sep 6, 2024
Sold by
Halpin Family Revocable Living Trust and Halpin Christopher C
Bought by
Ahh Llc
Current Estimated Value
Purchase Details
Closed on
Aug 20, 2012
Sold by
Fannie Mae
Bought by
Halpin Ruth E and Ruth E Halpin Revocable Living Trust
Purchase Details
Closed on
Jun 4, 2012
Sold by
Curtner Dave
Bought by
Fannie Mae and Federal National Mortgage Association
Purchase Details
Closed on
Aug 23, 2007
Sold by
Curtner Carmen L and Foster Charlotte M
Bought by
Curtner Dave
Home Financials for this Owner
Home Financials are based on the most recent Mortgage that was taken out on this home.
Original Mortgage
$56,800
Interest Rate
6.79%
Mortgage Type
Purchase Money Mortgage
Create a Home Valuation Report for This Property
The Home Valuation Report is an in-depth analysis detailing your home's value as well as a comparison with similar homes in the area
Home Values in the Area
Average Home Value in this Area
Purchase History
| Date | Buyer | Sale Price | Title Company |
|---|---|---|---|
| Ahh Llc | -- | None Listed On Document | |
| Ahh Llc | -- | None Listed On Document | |
| Halpin Ruth E | $28,000 | Attorney | |
| Fannie Mae | $28,000 | Attorney | |
| Curtner Dave | $56,800 | Title First Agency |
Source: Public Records
Mortgage History
| Date | Status | Borrower | Loan Amount |
|---|---|---|---|
| Previous Owner | Curtner Dave | $56,800 |
Source: Public Records
Tax History
| Year | Tax Paid | Tax Assessment Tax Assessment Total Assessment is a certain percentage of the fair market value that is determined by local assessors to be the total taxable value of land and additions on the property. | Land | Improvement |
|---|---|---|---|---|
| 2024 | $1,115 | $30,590 | $9,300 | $21,290 |
| 2023 | $1,130 | $33,090 | $9,300 | $23,790 |
| 2022 | $921 | $21,700 | $8,020 | $13,680 |
| 2021 | $930 | $21,700 | $8,020 | $13,680 |
| 2020 | $930 | $21,700 | $8,020 | $13,680 |
| 2019 | $824 | $19,250 | $6,770 | $12,480 |
| 2018 | $813 | $19,250 | $6,770 | $12,480 |
| 2017 | $897 | $21,250 | $6,770 | $14,480 |
| 2016 | $743 | $18,350 | $6,770 | $11,580 |
| 2015 | $745 | $18,350 | $6,770 | $11,580 |
| 2014 | $745 | $18,350 | $6,770 | $11,580 |
| 2013 | $829 | $18,860 | $6,770 | $12,090 |
Source: Public Records
Map
Nearby Homes
- 640 Maxwell Dr
- 115 Brooklyn Ave
- 307 Lake St
- 747 Clinton Ave
- 300 N Miami Ave
- 414 & 416 E Court St
- 400 Jefferson St
- 120 Bon Air Dr
- 909 Port Jefferson Rd
- 0 Shie Ave
- 1612 Red Oak
- 518 Brooklyn Ave
- 309 Hillcrest Ct
- 808 N Main Ave
- 105 N Ohio Ave Unit C
- 107 N Ohio Ave Unit C
- 109 E Water St
- 1203 Riverbend Blvd
- 1027 N Main Ave
- 834 N West Ave
- 616 Maxwell Dr
- 442 Riverside Dr
- 624 Mires Ln
- 606 Maxwell Place
- 436 Riverside Dr
- 606 Maxwell Dr
- 420 Riverside Dr Unit 422
- 630 Maxwell Dr
- 450 Riverside Dr
- 629 Mires Ln
- 429 Riverside Dr
- 429 Riverside Dr
- 441 Riverside Dr
- 419 Riverside Dr
- 635 Mires Ln
- 441 Riversider Dr
- 406 Riverside Dr
- 456 Riverside Dr
- 402 Riverside Dr
- 415 Riverside Dr
Your Personal Tour Guide
Ask me questions while you tour the home.