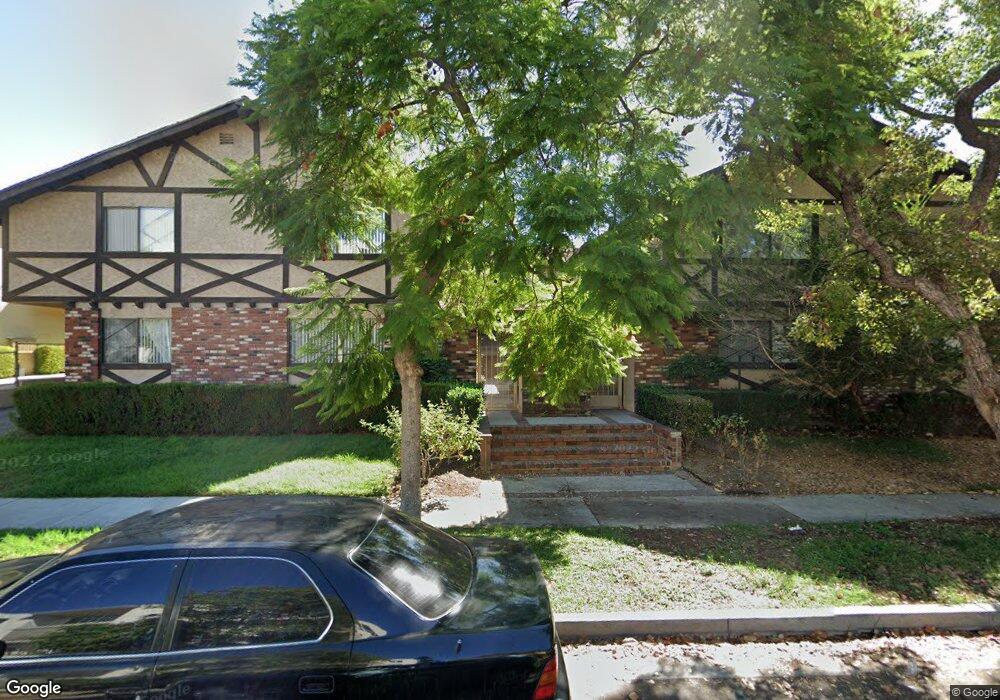
616 N Isabel St Unit 3 Glendale, CA 91206
City Center NeighborhoodEstimated Value: $627,000 - $697,000
2
Beds
3
Baths
1,190
Sq Ft
$551/Sq Ft
Est. Value
About This Home
This home is located at 616 N Isabel St Unit 3, Glendale, CA 91206 and is currently estimated at $656,243, approximately $551 per square foot. 616 N Isabel St Unit 3 is a home located in Los Angeles County with nearby schools including R.D. White Elementary School, Woodrow Wilson Middle School, and Glendale High School.
Ownership History
Date
Name
Owned For
Owner Type
Purchase Details
Closed on
May 20, 2020
Sold by
Okopnyi Daniel and Okopnyi Kelcey
Bought by
Okopnyi Daniel and Okopnyi Kelcey
Current Estimated Value
Home Financials for this Owner
Home Financials are based on the most recent Mortgage that was taken out on this home.
Original Mortgage
$420,000
Outstanding Balance
$372,178
Interest Rate
3.3%
Mortgage Type
New Conventional
Estimated Equity
$284,065
Purchase Details
Closed on
Jan 3, 2018
Sold by
Osman Sherine
Bought by
Okopnyi Daniel and Rardin Kelcey
Home Financials for this Owner
Home Financials are based on the most recent Mortgage that was taken out on this home.
Original Mortgage
$427,500
Interest Rate
3.94%
Mortgage Type
New Conventional
Purchase Details
Closed on
Nov 18, 2004
Sold by
Bhbk Llc
Bought by
Osman Sherine
Home Financials for this Owner
Home Financials are based on the most recent Mortgage that was taken out on this home.
Original Mortgage
$265,600
Interest Rate
4.62%
Mortgage Type
New Conventional
Create a Home Valuation Report for This Property
The Home Valuation Report is an in-depth analysis detailing your home's value as well as a comparison with similar homes in the area
Home Values in the Area
Average Home Value in this Area
Purchase History
| Date | Buyer | Sale Price | Title Company |
|---|---|---|---|
| Okopnyi Daniel | -- | Stewart Title | |
| Okopnyi Daniel | $475,000 | Equity Title Company | |
| Osman Sherine | $1,370,454 | Investors Title Company |
Source: Public Records
Mortgage History
| Date | Status | Borrower | Loan Amount |
|---|---|---|---|
| Open | Okopnyi Daniel | $420,000 | |
| Closed | Okopnyi Daniel | $427,500 | |
| Previous Owner | Osman Sherine | $265,600 | |
| Closed | Osman Sherine | $66,400 |
Source: Public Records
Tax History
| Year | Tax Paid | Tax Assessment Tax Assessment Total Assessment is a certain percentage of the fair market value that is determined by local assessors to be the total taxable value of land and additions on the property. | Land | Improvement |
|---|---|---|---|---|
| 2025 | $5,831 | $540,462 | $340,776 | $199,686 |
| 2024 | $5,831 | $529,866 | $334,095 | $195,771 |
| 2023 | $5,697 | $519,478 | $327,545 | $191,933 |
| 2022 | $5,594 | $509,293 | $321,123 | $188,170 |
| 2021 | $5,496 | $499,308 | $314,827 | $184,481 |
| 2019 | $5,282 | $484,500 | $305,490 | $179,010 |
| 2018 | $4,454 | $406,708 | $161,702 | $245,006 |
| 2016 | $4,242 | $390,917 | $155,424 | $235,493 |
| 2015 | $3,950 | $366,000 | $146,000 | $220,000 |
| 2014 | $3,843 | $352,000 | $140,000 | $212,000 |
Source: Public Records
Map
Nearby Homes
- 520 N Howard St
- 515 N Jackson St Unit 101
- 515 N Jackson St Unit 206
- 645 Balboa Ave
- 612 N Louise St Unit 307
- 411 N Jackson St Unit 104
- 222 Monterey Rd Unit 104
- 222 Monterey Rd Unit 1205
- 222 Monterey Rd Unit 306
- 222 Monterey Rd Unit 1603
- 222 Monterey Rd Unit 1306
- 530 N Maryland Ave
- 331 N Isabel St Unit 4
- 330 N Howard St Unit 108
- 322 N Isabel St
- 310 N Jackson St Unit 104
- 330 N Jackson St Unit 314
- 312 N Louise St Unit 210
- 312 N Louise St Unit 108
- 537 N Adams St Unit 212
- 616 N Isabel St Unit 9
- 616 N Isabel St Unit 7
- 616 N Isabel St Unit 6
- 616 N Isabel St Unit 5
- 616 N Isabel St Unit 1
- 616 N Isabel St Unit 8
- 616 N Isabel St Unit 2
- 616 N Isabel St Unit 10
- 616 N Isabel St Unit 4
- 616 N Isabel St Unit 4
- 610 N Isabel St Unit 1
- 610 N Isabel St Unit 2
- 610 N Isabel St Unit 3
- 610 N Isabel St Unit 4
- 610 N Isabel St Unit 5
- 622 N Isabel St
- 604 N Isabel St Unit A
- 604 N Isabel St
- 626 N Isabel St Unit 303
- 626 N Isabel St Unit 302
Your Personal Tour Guide
Ask me questions while you tour the home.