Estimated Value: $470,286 - $528,000
3
Beds
2
Baths
2,546
Sq Ft
$194/Sq Ft
Est. Value
About This Home
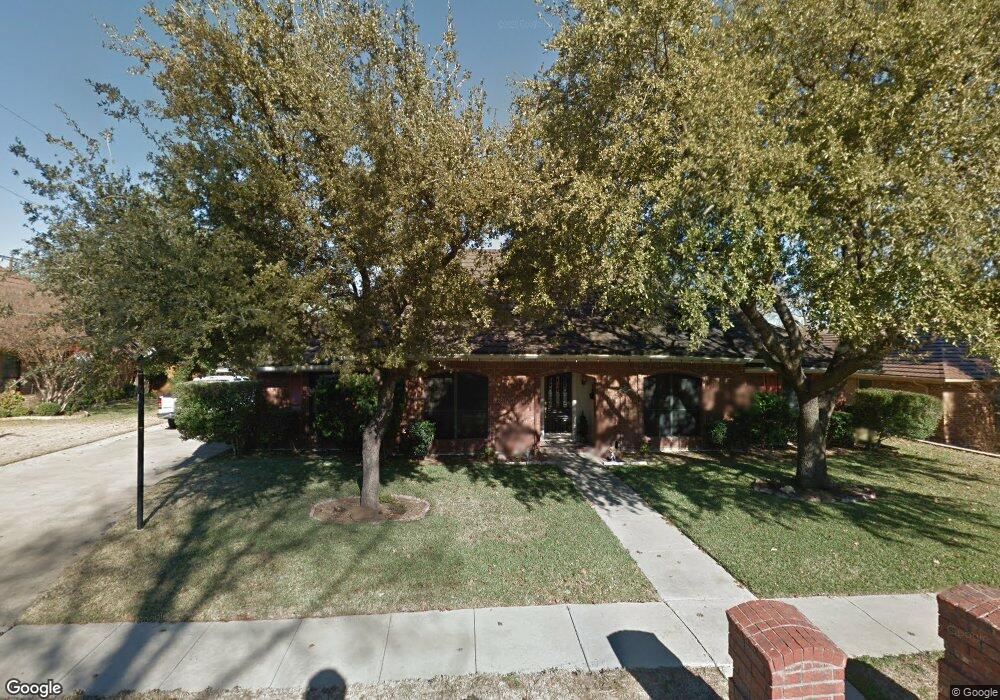
This home is located at 616 Oakview Dr, Hurst, TX 76054 and is currently estimated at $493,822, approximately $193 per square foot. 616 Oakview Dr is a home located in Tarrant County with nearby schools including W.A. Porter Elementary School, Smithfield Middle School, and Birdville High School.
Ownership History
Date
Name
Owned For
Owner Type
Purchase Details
Closed on
Oct 9, 2024
Sold by
Gray Kathleen Mary
Bought by
Gray Family Trust and Gray
Current Estimated Value
Purchase Details
Closed on
May 25, 2006
Sold by
Hoeschen Donna and Becker Mary Elsie
Bought by
Gray Michael J and Gray Kathy
Home Financials for this Owner
Home Financials are based on the most recent Mortgage that was taken out on this home.
Original Mortgage
$183,200
Interest Rate
6.5%
Mortgage Type
Fannie Mae Freddie Mac
Purchase Details
Closed on
May 20, 2003
Sold by
Davis Jeffrey Lynn and Gayle Pamela
Bought by
Becker Mary and Hoeschen Donna
Home Financials for this Owner
Home Financials are based on the most recent Mortgage that was taken out on this home.
Original Mortgage
$164,500
Interest Rate
4.12%
Mortgage Type
Purchase Money Mortgage
Create a Home Valuation Report for This Property
The Home Valuation Report is an in-depth analysis detailing your home's value as well as a comparison with similar homes in the area
Home Values in the Area
Average Home Value in this Area
Purchase History
| Date | Buyer | Sale Price | Title Company |
|---|---|---|---|
| Gray Family Trust | -- | None Listed On Document | |
| Gray Michael J | -- | None Available | |
| Becker Mary | -- | First American Title |
Source: Public Records
Mortgage History
| Date | Status | Borrower | Loan Amount |
|---|---|---|---|
| Previous Owner | Gray Michael J | $183,200 | |
| Previous Owner | Becker Mary | $164,500 |
Source: Public Records
Tax History
| Year | Tax Paid | Tax Assessment Tax Assessment Total Assessment is a certain percentage of the fair market value that is determined by local assessors to be the total taxable value of land and additions on the property. | Land | Improvement |
|---|---|---|---|---|
| 2025 | $6,318 | $444,063 | $90,000 | $354,063 |
| 2024 | $6,318 | $444,063 | $90,000 | $354,063 |
| 2023 | $9,756 | $426,870 | $90,000 | $336,870 |
| 2022 | $9,795 | $396,761 | $55,000 | $341,761 |
| 2021 | $9,343 | $360,287 | $55,000 | $305,287 |
| 2020 | $8,414 | $327,425 | $55,000 | $272,425 |
| 2019 | $8,239 | $340,949 | $55,000 | $285,949 |
| 2017 | $6,913 | $271,527 | $55,000 | $216,527 |
| 2016 | $6,284 | $235,513 | $40,000 | $195,513 |
Source: Public Records
Map
Nearby Homes
- 717 Ashley Dr
- 3220 David Dr
- 3229 David Dr
- 3308 Texas Trail Ct
- 716 Bridget Way
- 2925 Ridgewood Dr
- 625 Palo Duro Dr
- 6708 Nob Hill Ct
- 9205 Cooper Ct
- 6704 Nob Hill Ct
- 713 Corsair Ct
- 3512 Osprey Dr
- 712 Doppler Ct
- 8908 Marti Ln
- 9120 Nob Hill Dr
- 712 Bear Creek Dr
- 3612 Bordeaux Ln
- 8966 Hialeah Cir S
- 753 Toni Dr
- 712 Springhill Dr
- 620 Oakview Dr
- 609 Ludo Cir
- 3141 Woodridge Dr
- 3140 Oakdale Dr
- 3208 Oakdale Dr
- 605 Ludo Cir
- 608 Ludo Cir
- 3201 Oakdale Dr
- 3137 Woodridge Dr
- 3136 Oakdale Dr
- 604 Oakview Dr
- 3145 Oakdale Dr
- 3136 Woodridge Dr
- 3212 Oakdale Dr
- 3209 Oakdale Dr
- 3141 Oakdale Dr
- 604 Ludo Cir
- 3133 Woodridge Dr
- 3205 Hurstview Dr
- 3132 Woodridge Dr
Your Personal Tour Guide
Ask me questions while you tour the home.