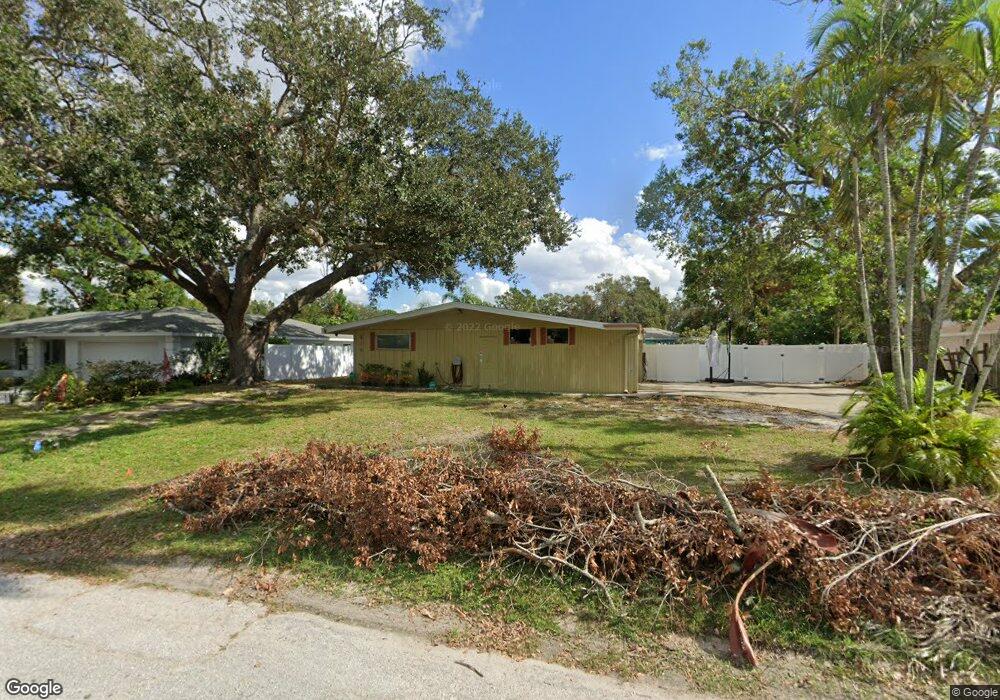
616 Saint Andrews Dr Sarasota, FL 34243
Estimated Value: $380,000 - $421,569
3
Beds
2
Baths
2,241
Sq Ft
$181/Sq Ft
Est. Value
About This Home
This home is located at 616 Saint Andrews Dr, Sarasota, FL 34243 and is currently estimated at $404,642, approximately $180 per square foot. 616 Saint Andrews Dr is a home located in Manatee County with nearby schools including Florine J. Abel Elementary School, Electa Lee Magnet Middle School, and Southeast High School.
Ownership History
Date
Name
Owned For
Owner Type
Purchase Details
Closed on
Sep 5, 2025
Sold by
Triplett Alex
Bought by
Brunzell James L
Current Estimated Value
Home Financials for this Owner
Home Financials are based on the most recent Mortgage that was taken out on this home.
Original Mortgage
$225,000
Outstanding Balance
$225,000
Interest Rate
6.72%
Mortgage Type
New Conventional
Estimated Equity
$179,642
Purchase Details
Closed on
Sep 26, 2016
Sold by
Diroff Joseph M and Diroff Alys M
Bought by
Brunzell James L and Triplett Alex
Home Financials for this Owner
Home Financials are based on the most recent Mortgage that was taken out on this home.
Original Mortgage
$193,431
Interest Rate
4.4%
Mortgage Type
FHA
Purchase Details
Closed on
Jan 30, 1998
Sold by
Diroff Alys M
Bought by
Diroff Joseph M and Diroff Alys M
Create a Home Valuation Report for This Property
The Home Valuation Report is an in-depth analysis detailing your home's value as well as a comparison with similar homes in the area
Home Values in the Area
Average Home Value in this Area
Purchase History
| Date | Buyer | Sale Price | Title Company |
|---|---|---|---|
| Brunzell James L | $39,200 | First International Title | |
| Brunzell James L | $197,000 | None Available | |
| Diroff Joseph M | -- | -- |
Source: Public Records
Mortgage History
| Date | Status | Borrower | Loan Amount |
|---|---|---|---|
| Open | Brunzell James L | $225,000 | |
| Previous Owner | Brunzell James L | $193,431 |
Source: Public Records
Tax History Compared to Growth
Tax History
| Year | Tax Paid | Tax Assessment Tax Assessment Total Assessment is a certain percentage of the fair market value that is determined by local assessors to be the total taxable value of land and additions on the property. | Land | Improvement |
|---|---|---|---|---|
| 2025 | $4,982 | $327,065 | $97,325 | $229,740 |
| 2024 | $4,982 | $360,314 | $97,325 | $262,989 |
| 2023 | $4,625 | $350,110 | $76,500 | $273,610 |
| 2022 | $3,448 | $296,665 | $75,000 | $221,665 |
| 2021 | $3,310 | $207,921 | $55,000 | $152,921 |
| 2020 | $3,143 | $185,867 | $40,000 | $145,867 |
| 2019 | $3,193 | $187,621 | $40,000 | $147,621 |
| 2018 | $3,095 | $179,792 | $40,000 | $139,792 |
| 2017 | $2,709 | $163,863 | $0 | $0 |
| 2016 | $1,035 | $93,695 | $0 | $0 |
| 2015 | $1,032 | $93,044 | $0 | $0 |
| 2014 | $1,032 | $92,306 | $0 | $0 |
| 2013 | $1,008 | $90,942 | $26,000 | $64,942 |
Source: Public Records
Map
Nearby Homes
- 7205 Alderwood Dr
- 530 Saint Andrews Dr
- 813 Cypress Wood Ln
- 7222 Meadowbrook Dr
- 7019 8th Ct E
- 7304 Claries Dr
- 911 Wee Burn Place
- 7213 Las Casas Dr Unit 18
- 7225 Willow St
- 927 Byron Ln Unit 13-B
- 940 Byron Ct Unit 17
- 6860 Whitman Ct Unit 32B
- 361 Whitfield Ave
- 344 Lantana Ave
- 1052 Longfellow Cir
- 1112 Longfellow Rd
- 7303 Manatee St
- 608 69th Ave W
- 1219 70th Dr E
- 1190 Longfellow Way Unit 135-C
- 620 Saint Andrews Dr
- 612 Saint Andrews Dr
- 703 Mcarthur Ave
- 613 Mcarthur Ave
- 624 St Andrews Dr
- 615 Saint Andrews Dr
- 608 Saint Andrews Dr
- 624 Saint Andrews Dr
- 7124 Alderwood Dr
- 611 Saint Andrews Dr
- 7120 Alderwood Dr
- 619 Saint Andrews Dr
- 609 Mcarthur Ave
- 707 Mcarthur Ave
- 7116 Alderwood Dr
- 607 Saint Andrews Dr
- 604 Saint Andrews Dr
- 534 Chevy Chase Dr
- 7205 Arcturas Dr
- 538 Chevy Chase Dr