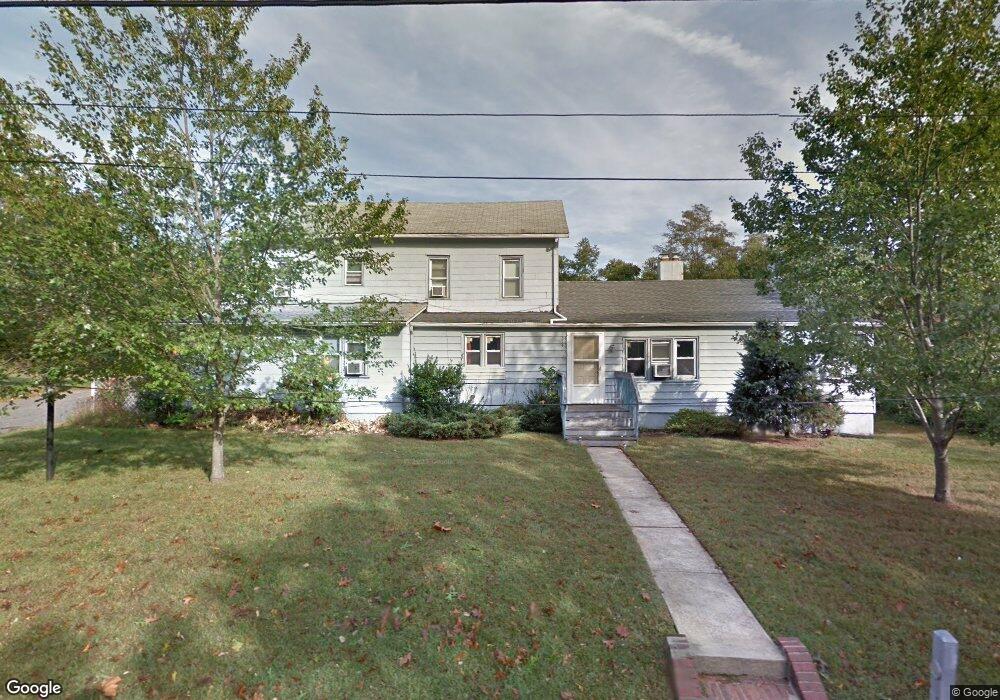
616 W Farms Rd Howell, NJ 07731
Adelphia NeighborhoodEstimated Value: $817,000 - $950,382
5
Beds
3
Baths
3,052
Sq Ft
$288/Sq Ft
Est. Value
About This Home
This home is located at 616 W Farms Rd, Howell, NJ 07731 and is currently estimated at $879,596, approximately $288 per square foot. 616 W Farms Rd is a home located in Monmouth County with nearby schools including Griebling School, Howell Township Memorial Elementary School, and Howell Middle School North.
Ownership History
Date
Name
Owned For
Owner Type
Purchase Details
Closed on
Mar 3, 2000
Sold by
Moscatiello Richard
Bought by
Makram Abdou and Abdou Amira
Current Estimated Value
Home Financials for this Owner
Home Financials are based on the most recent Mortgage that was taken out on this home.
Original Mortgage
$173,950
Outstanding Balance
$58,487
Interest Rate
8.18%
Estimated Equity
$821,109
Create a Home Valuation Report for This Property
The Home Valuation Report is an in-depth analysis detailing your home's value as well as a comparison with similar homes in the area
Home Values in the Area
Average Home Value in this Area
Purchase History
| Date | Buyer | Sale Price | Title Company |
|---|---|---|---|
| Makram Abdou | $248,500 | -- |
Source: Public Records
Mortgage History
| Date | Status | Borrower | Loan Amount |
|---|---|---|---|
| Open | Makram Abdou | $173,950 |
Source: Public Records
Tax History Compared to Growth
Tax History
| Year | Tax Paid | Tax Assessment Tax Assessment Total Assessment is a certain percentage of the fair market value that is determined by local assessors to be the total taxable value of land and additions on the property. | Land | Improvement |
|---|---|---|---|---|
| 2025 | $13,494 | $839,900 | $378,300 | $461,600 |
| 2024 | $13,214 | $771,500 | $318,300 | $453,200 |
| 2023 | $13,214 | $721,700 | $279,100 | $442,600 |
| 2022 | $14,461 | $659,100 | $237,800 | $421,300 |
| 2021 | $14,461 | $641,000 | $237,800 | $403,200 |
| 2020 | $14,096 | $617,700 | $219,100 | $398,600 |
| 2019 | $14,236 | $611,000 | $219,100 | $391,900 |
| 2018 | $13,887 | $592,700 | $219,100 | $373,600 |
| 2017 | $13,912 | $587,500 | $225,300 | $362,200 |
| 2016 | $13,001 | $541,500 | $194,100 | $347,400 |
| 2015 | $12,924 | $532,500 | $194,100 | $338,400 |
| 2014 | $12,546 | $476,300 | $202,800 | $273,500 |
Source: Public Records
Map
Nearby Homes