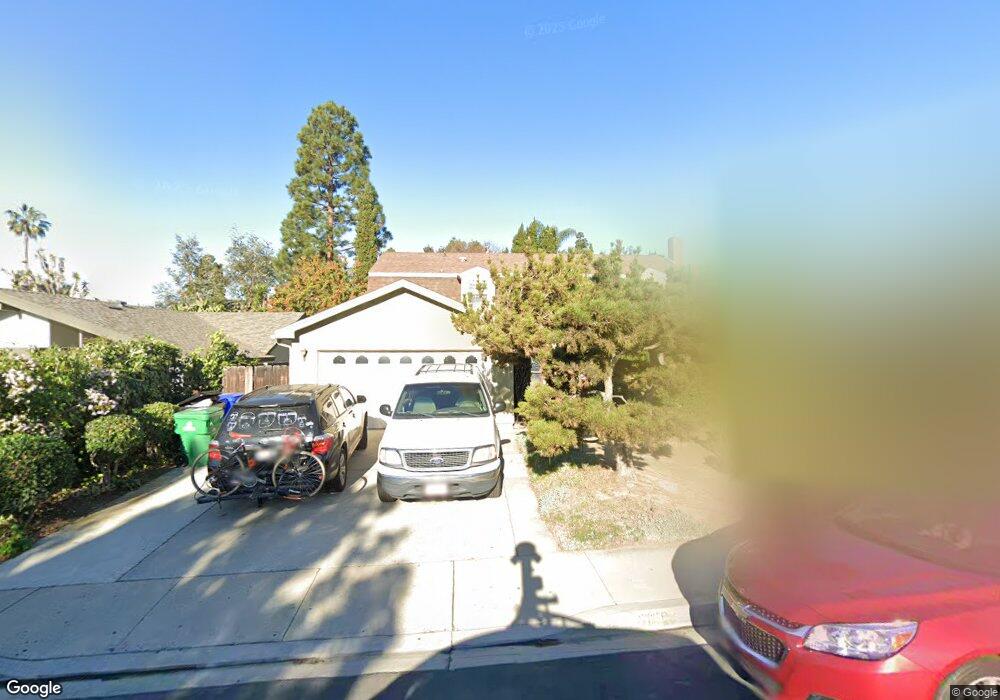
6160 Charae St San Diego, CA 92122
University City NeighborhoodEstimated Value: $1,672,165 - $1,831,000
5
Beds
3
Baths
2,169
Sq Ft
$805/Sq Ft
Est. Value
About This Home
This home is located at 6160 Charae St, San Diego, CA 92122 and is currently estimated at $1,747,041, approximately $805 per square foot. 6160 Charae St is a home located in San Diego County with nearby schools including Marie Curie Elementary School, Standley Middle School, and University City High School.
Ownership History
Date
Name
Owned For
Owner Type
Purchase Details
Closed on
Jul 28, 2020
Sold by
Hwang Pang Hsiung and Hwang Fang Lain
Bought by
Hwang Pang Hsiung and Hwang Fang Lain
Current Estimated Value
Home Financials for this Owner
Home Financials are based on the most recent Mortgage that was taken out on this home.
Original Mortgage
$500,000
Outstanding Balance
$439,489
Interest Rate
2.9%
Mortgage Type
New Conventional
Estimated Equity
$1,307,552
Purchase Details
Closed on
Jul 30, 1999
Sold by
Hsiung Hwang Pang and Lain Fang
Bought by
Hwang Pang Hsiung and Hwang Fang Lain
Purchase Details
Closed on
Oct 21, 1994
Sold by
Mendenhall Robert W and Mendenhall Kathleen W
Bought by
Hwang Pang Hsiung and Hwang Fang Lain
Purchase Details
Closed on
Jul 26, 1991
Purchase Details
Closed on
Jan 29, 1986
Create a Home Valuation Report for This Property
The Home Valuation Report is an in-depth analysis detailing your home's value as well as a comparison with similar homes in the area
Home Values in the Area
Average Home Value in this Area
Purchase History
| Date | Buyer | Sale Price | Title Company |
|---|---|---|---|
| Hwang Pang Hsiung | -- | Amrock Inc | |
| Hwang Pang Hsiung | -- | Amrock Inc | |
| Hwang Pang Hsiung | -- | -- | |
| Hwang Pang Hsiung | $970,000 | Old Republic Title Company | |
| -- | $300,000 | -- | |
| -- | $184,500 | -- |
Source: Public Records
Mortgage History
| Date | Status | Borrower | Loan Amount |
|---|---|---|---|
| Open | Hwang Pang Hsiung | $500,000 |
Source: Public Records
Tax History Compared to Growth
Tax History
| Year | Tax Paid | Tax Assessment Tax Assessment Total Assessment is a certain percentage of the fair market value that is determined by local assessors to be the total taxable value of land and additions on the property. | Land | Improvement |
|---|---|---|---|---|
| 2025 | $6,422 | $530,474 | $265,237 | $265,237 |
| 2024 | $6,422 | $520,074 | $260,037 | $260,037 |
| 2023 | $6,280 | $509,878 | $254,939 | $254,939 |
| 2022 | $6,113 | $499,882 | $249,941 | $249,941 |
| 2021 | $6,072 | $490,082 | $245,041 | $245,041 |
| 2020 | $5,998 | $485,058 | $242,529 | $242,529 |
| 2019 | $5,892 | $475,548 | $237,774 | $237,774 |
| 2018 | $5,509 | $466,224 | $233,112 | $233,112 |
| 2017 | $81 | $457,084 | $228,542 | $228,542 |
| 2016 | $5,292 | $448,122 | $224,061 | $224,061 |
| 2015 | $5,214 | $441,392 | $220,696 | $220,696 |
| 2014 | $5,132 | $432,746 | $216,373 | $216,373 |
Source: Public Records
Map
Nearby Homes
- 6214 Agee St Unit 34
- 6188 Agee St Unit 230
- 5962 Agee St
- 6330 Genesee Ave Unit 220
- 6330 Genesee Ave Unit 112
- 6330 Genesee Ave Unit 213
- 5889 Cozzens St
- 5977 Erlanger St
- 6547 Radcliffe Dr
- 4612 Benhurst Ave
- 4282 Robbins St
- 3736 Millikin Ave
- 4495 Cather Ave
- 4635 Pauling Ave
- 3598 Syracuse Ave
- 6614 Dennison St
- 4627 Huggins St
- 3542 Governor Dr
- 6174 Syracuse Way
- 7212 Florey St