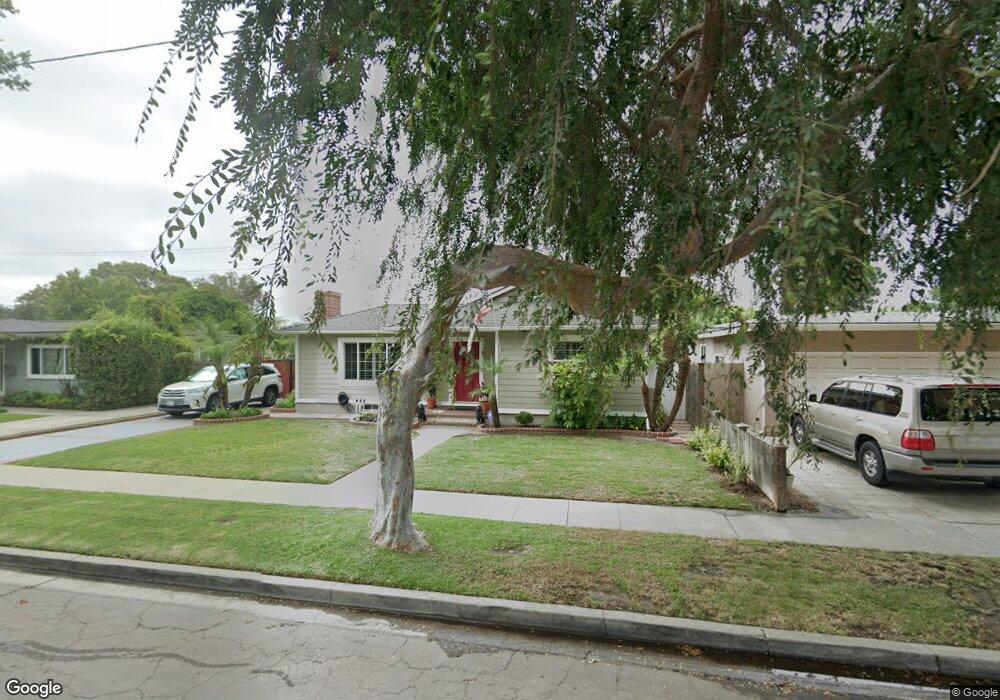
6160 E Walton St Long Beach, CA 90815
Los Altos North NeighborhoodEstimated Value: $1,092,894 - $1,200,000
3
Beds
2
Baths
1,450
Sq Ft
$791/Sq Ft
Est. Value
About This Home
This home is located at 6160 E Walton St, Long Beach, CA 90815 and is currently estimated at $1,146,974, approximately $791 per square foot. 6160 E Walton St is a home located in Los Angeles County with nearby schools including Prisk Elementary School, Stanford Middle School, and Millikan High School.
Ownership History
Date
Name
Owned For
Owner Type
Purchase Details
Closed on
Sep 18, 2023
Sold by
Castro Steven and Castro Lucinda Ruby
Bought by
Castro Family Trust and Castro
Current Estimated Value
Purchase Details
Closed on
Aug 14, 1998
Sold by
Santore Kenna L
Bought by
Castro Steven
Home Financials for this Owner
Home Financials are based on the most recent Mortgage that was taken out on this home.
Original Mortgage
$213,600
Interest Rate
6.88%
Purchase Details
Closed on
Mar 29, 1996
Sold by
Cosper Scott W
Bought by
Santore Kenna L
Home Financials for this Owner
Home Financials are based on the most recent Mortgage that was taken out on this home.
Original Mortgage
$144,000
Interest Rate
7.34%
Purchase Details
Closed on
Dec 15, 1993
Sold by
Cosper Fred G and Cosper Lorna B
Bought by
Cosper Fred G
Home Financials for this Owner
Home Financials are based on the most recent Mortgage that was taken out on this home.
Original Mortgage
$51,000
Interest Rate
7.2%
Create a Home Valuation Report for This Property
The Home Valuation Report is an in-depth analysis detailing your home's value as well as a comparison with similar homes in the area
Home Values in the Area
Average Home Value in this Area
Purchase History
| Date | Buyer | Sale Price | Title Company |
|---|---|---|---|
| Castro Family Trust | -- | None Listed On Document | |
| Castro Steven | $225,000 | Southland Title | |
| Santore Kenna L | $180,000 | -- | |
| Cosper Fred G | -- | Southland Title Corporation |
Source: Public Records
Mortgage History
| Date | Status | Borrower | Loan Amount |
|---|---|---|---|
| Previous Owner | Castro Steven | $213,600 | |
| Previous Owner | Santore Kenna L | $144,000 | |
| Previous Owner | Cosper Fred G | $51,000 |
Source: Public Records
Tax History
| Year | Tax Paid | Tax Assessment Tax Assessment Total Assessment is a certain percentage of the fair market value that is determined by local assessors to be the total taxable value of land and additions on the property. | Land | Improvement |
|---|---|---|---|---|
| 2025 | $4,632 | $352,555 | $223,704 | $128,851 |
| 2024 | $4,632 | $345,643 | $219,318 | $126,325 |
| 2023 | $4,553 | $338,867 | $215,018 | $123,849 |
| 2022 | $4,276 | $332,223 | $210,802 | $121,421 |
| 2021 | $4,184 | $325,710 | $206,669 | $119,041 |
| 2019 | $4,121 | $316,051 | $200,540 | $115,511 |
| 2018 | $3,966 | $309,855 | $196,608 | $113,247 |
| 2016 | $3,641 | $297,824 | $188,974 | $108,850 |
| 2015 | $3,497 | $293,351 | $186,136 | $107,215 |
| 2014 | $3,474 | $287,605 | $182,490 | $105,115 |
Source: Public Records
Map
Nearby Homes
- 6110 E Walton St
- 2690 Senasac Ave
- 2345 Palo Verde Ave
- 2306 Carfax Ave
- 6448 E Los Arcos St
- 2276 Fanwood Ave
- 2330 Josie Ave
- 2419 Ostrom Ave
- 6702 E El Salvador St
- 2715 Petaluma Ave
- 3012 Knoxville Ave
- 2616 Foreman Ave
- 2410 2412 Termino Ave
- 7890 4A E Spring St Unit 4A
- 2411 2413 Termino
- 3034 Ocana Ave
- 3166 Senasac Ave
- 3044 Ocana Ave
- 2137 Ostrom Ave
- 3120 San Anseline Ave
- 6150 E Walton St
- 6170 E Walton St
- 6140 E Walton St
- 6167 E Walton St
- 6155 E Walton St
- 6130 E Walton St
- 6141 E Walton St
- 6156 E Oakbrook St
- 6131 E Walton St
- 6120 E Walton St
- 6121 E Walton St
- 6126 E Oakbrook St
- 6165 E Oakbrook St
- 6140 E Oakbrook St
- 6111 E Walton St
- 6157 E Oakbrook St
- 6100 E Walton St
- 6149 E Oakbrook St
- 6134 E Oakbrook St
- 6122 E Oakbrook St