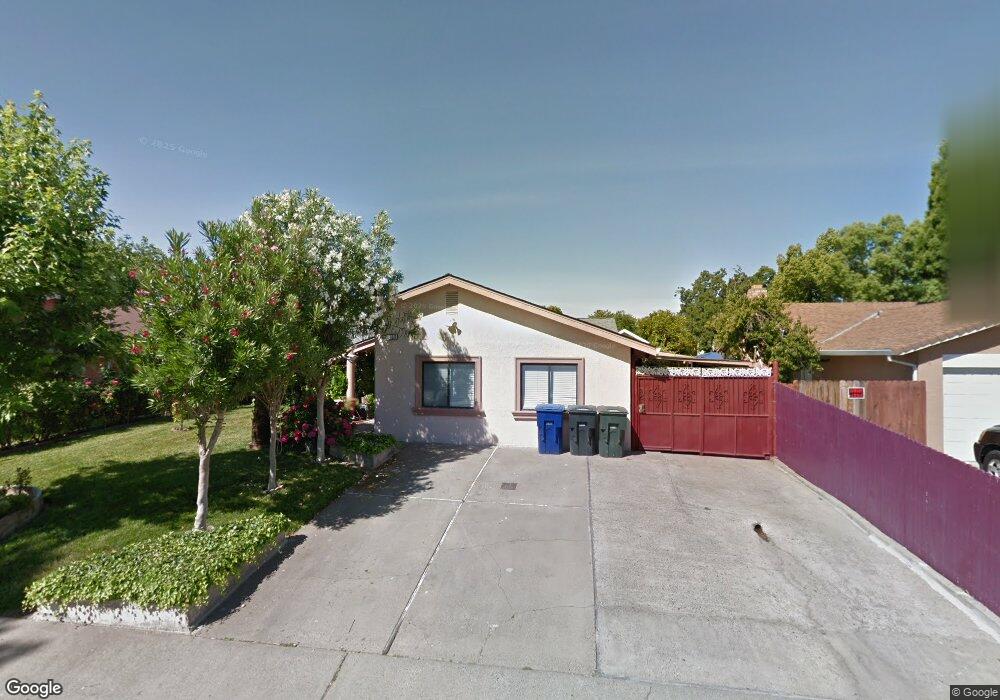
6160 Hesby Way Sacramento, CA 95823
North Laguna NeighborhoodEstimated Value: $317,000 - $442,087
4
Beds
2
Baths
1,654
Sq Ft
$244/Sq Ft
Est. Value
About This Home
This home is located at 6160 Hesby Way, Sacramento, CA 95823 and is currently estimated at $403,272, approximately $243 per square foot. 6160 Hesby Way is a home located in Sacramento County with nearby schools including Herman Leimbach Elementary School, Samuel Jackman Middle School, and Valley High School.
Ownership History
Date
Name
Owned For
Owner Type
Purchase Details
Closed on
Jan 5, 2021
Sold by
Marginean Constantin and Marginean Ileana
Bought by
Cioran Lenuta Adela and Marginean Family Trust
Current Estimated Value
Purchase Details
Closed on
Dec 26, 2012
Sold by
Cioran Anghel
Bought by
Cioran Lenuta A
Home Financials for this Owner
Home Financials are based on the most recent Mortgage that was taken out on this home.
Original Mortgage
$69,000
Interest Rate
3.27%
Mortgage Type
New Conventional
Purchase Details
Closed on
Jun 17, 2004
Sold by
Cioran Lenuta A and Marginean Constantin
Bought by
Cioran Lenuta A
Home Financials for this Owner
Home Financials are based on the most recent Mortgage that was taken out on this home.
Original Mortgage
$75,000
Interest Rate
6.29%
Mortgage Type
New Conventional
Create a Home Valuation Report for This Property
The Home Valuation Report is an in-depth analysis detailing your home's value as well as a comparison with similar homes in the area
Home Values in the Area
Average Home Value in this Area
Purchase History
| Date | Buyer | Sale Price | Title Company |
|---|---|---|---|
| Cioran Lenuta Adela | -- | None Available | |
| Marginean Constantin | -- | None Available | |
| Cioran Lenuta A | -- | Cornerstone Title Company | |
| Cioran Lenuta A | -- | Chicago Title Co |
Source: Public Records
Mortgage History
| Date | Status | Borrower | Loan Amount |
|---|---|---|---|
| Closed | Cioran Lenuta A | $69,000 | |
| Closed | Cioran Lenuta A | $75,000 |
Source: Public Records
Tax History Compared to Growth
Tax History
| Year | Tax Paid | Tax Assessment Tax Assessment Total Assessment is a certain percentage of the fair market value that is determined by local assessors to be the total taxable value of land and additions on the property. | Land | Improvement |
|---|---|---|---|---|
| 2025 | $1,759 | $153,312 | $36,776 | $116,536 |
| 2024 | $1,759 | $150,306 | $36,055 | $114,251 |
| 2023 | $1,705 | $147,360 | $35,349 | $112,011 |
| 2022 | $1,688 | $144,471 | $34,656 | $109,815 |
| 2021 | $1,657 | $141,639 | $33,977 | $107,662 |
| 2020 | $1,629 | $140,188 | $33,629 | $106,559 |
| 2019 | $1,598 | $137,440 | $32,970 | $104,470 |
| 2018 | $1,553 | $134,746 | $32,324 | $102,422 |
| 2017 | $1,519 | $132,105 | $31,691 | $100,414 |
| 2016 | $1,477 | $129,516 | $31,070 | $98,446 |
| 2015 | $1,442 | $127,572 | $30,604 | $96,968 |
| 2014 | $1,426 | $125,074 | $30,005 | $95,069 |
Source: Public Records
Map
Nearby Homes
- 6119 Bamford Dr
- 5975 Bamford Dr
- 5953 Bamford Dr
- 7948 Grandstaff Dr
- 7952 Grandstaff Dr
- 8018 Center Pkwy
- 6439 Valley hi Dr
- 5385 Bamford Dr
- 6330 Valley hi Dr
- 5530 Seyferth Way
- 7741 Telfer Way
- 86 Thatcher Cir
- 57 Kennelford Cir
- 63 Omaha Ct
- 6028 Hollyhurst Way
- 8160 Valley Green Dr
- 7700 La Mancha Way
- 6420 S Elder Ct
- 8169 Valley Green Dr
- 7734 Whispering Palms Dr
- 6150 Hesby Way
- 6170 Hesby Way
- 6180 Hesby Way
- 6140 Hesby Way
- 6151 Hesby Way
- 6161 Hesby Way
- 6141 Hesby Way
- 6171 Hesby Way
- 6190 Hesby Way
- 6130 Hesby Way
- 6121 Hesby Way
- 6256 Goodview Way
- 6191 Hesby Way
- 6260 Goodview Way
- 6194 Hesby Way
- 6111 Hesby Way
- 6266 Goodview Way
- 6120 Hesby Way
- 6250 Goodview Way
- 6159 Heath Way