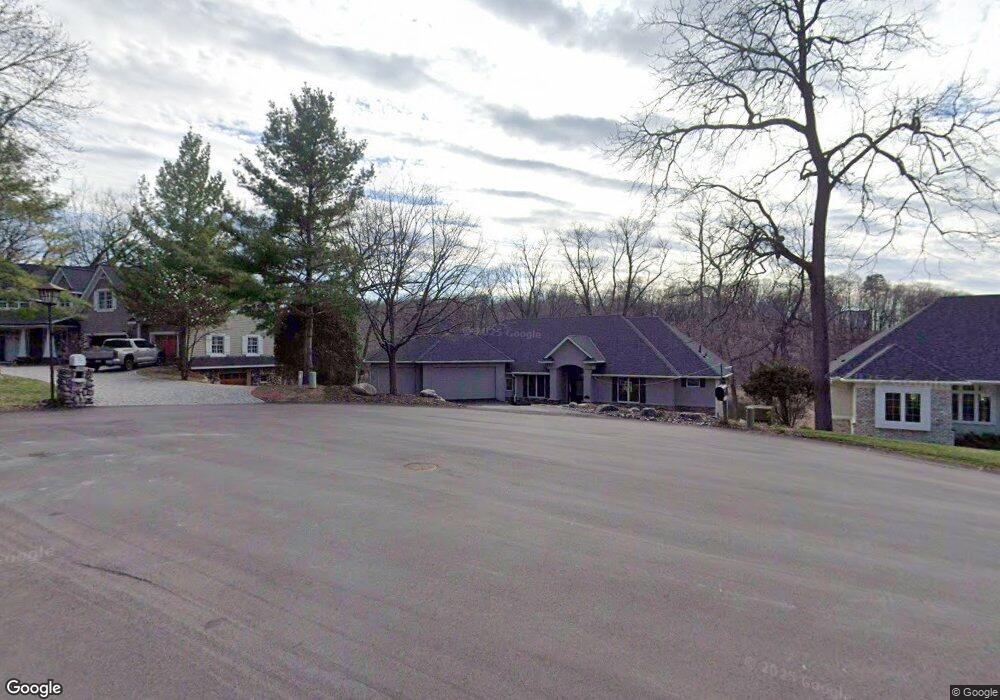
6160 Murray Ct Excelsior, MN 55331
Estimated Value: $801,000 - $951,000
3
Beds
3
Baths
1,889
Sq Ft
$455/Sq Ft
Est. Value
About This Home
This home is located at 6160 Murray Ct, Excelsior, MN 55331 and is currently estimated at $859,992, approximately $455 per square foot. 6160 Murray Ct is a home located in Hennepin County with nearby schools including Excelsior Elementary School, Minnetonka West Middle School, and Minnetonka Senior High School.
Ownership History
Date
Name
Owned For
Owner Type
Purchase Details
Closed on
Oct 26, 2022
Sold by
Waligoski Sandra
Bought by
Sandra A Waligoski Trust
Current Estimated Value
Purchase Details
Closed on
Jul 19, 2017
Sold by
Reagan John R and Reagan Mikell W
Bought by
Waligoski Sandra
Purchase Details
Closed on
Nov 29, 2001
Sold by
Colson Custom Homes Llc
Bought by
Reagan John R and Reagan Mikell W
Purchase Details
Closed on
Dec 22, 2000
Sold by
Nortrax Realty Llc
Bought by
Tonka Development
Purchase Details
Closed on
Aug 17, 2000
Sold by
Trickey Tob S and Trickey Mary B
Bought by
Nortrax Realty L L C
Purchase Details
Closed on
Apr 14, 2000
Sold by
Fehrenbach James David and Fehrenbach Jenny M
Bought by
Trickey Tob S and Trickey Penny B
Purchase Details
Closed on
Jan 14, 1997
Sold by
Willis Builders Inc
Bought by
Fehrenbach James David and Rempfer Jenny M
Create a Home Valuation Report for This Property
The Home Valuation Report is an in-depth analysis detailing your home's value as well as a comparison with similar homes in the area
Home Values in the Area
Average Home Value in this Area
Purchase History
| Date | Buyer | Sale Price | Title Company |
|---|---|---|---|
| Sandra A Waligoski Trust | $500 | -- | |
| Waligoski Sandra | $590,000 | Edina Realty Title Inc | |
| Reagan John R | $601,769 | -- | |
| Tonka Development | $116,400 | -- | |
| Nortrax Realty L L C | $123,484 | -- | |
| Trickey Tob S | $117,500 | -- | |
| Fehrenbach James David | $120,000 | -- |
Source: Public Records
Tax History Compared to Growth
Tax History
| Year | Tax Paid | Tax Assessment Tax Assessment Total Assessment is a certain percentage of the fair market value that is determined by local assessors to be the total taxable value of land and additions on the property. | Land | Improvement |
|---|---|---|---|---|
| 2024 | $8,959 | $724,600 | $161,000 | $563,600 |
| 2023 | $9,589 | $801,200 | $235,000 | $566,200 |
| 2022 | $8,227 | $741,000 | $200,000 | $541,000 |
| 2021 | $8,012 | $623,000 | $154,000 | $469,000 |
| 2020 | $8,041 | $604,000 | $154,000 | $450,000 |
| 2019 | $7,996 | $581,000 | $145,000 | $436,000 |
| 2018 | $8,202 | $575,000 | $143,000 | $432,000 |
| 2017 | $8,788 | $617,000 | $198,000 | $419,000 |
| 2016 | $8,294 | $578,000 | $207,000 | $371,000 |
| 2015 | $8,190 | $570,000 | $199,000 | $371,000 |
| 2014 | -- | $563,000 | $210,000 | $353,000 |
Source: Public Records
Map
Nearby Homes
- 6155 Murray Ct
- 1770 Pheasant Cir
- 6040 Oakview Ct
- 6140 Chaska Rd
- 6456 Yosemite Ln
- 6591 Galpin Blvd
- 6480 Yosemite
- 2150 Crestview Dr
- 351 Morse Ave
- 5910 Minnetonka Dr
- 205 Mill St Unit S205
- 6430 Bretton Way
- 6491 Bretton Way
- 151 Bell St
- 126 Courtland St
- 163 2nd St
- 1350 Heather Ct
- 150 1st St
- 88 1st St
- 5800 Echo Rd
- 6140 Murray Ct
- 6180 Murray Ct
- 6180 Murray Ct
- 6120 6120 Murray Ct
- 6120 Murray Ct
- 620X Cardinal Ave
- 26 Address Unassigned Ave
- 22695 Murray St
- 22765 Murray St
- 6200 Cardinal Ave
- 22785 Murray St
- 1830 Koehnen Cir
- 6261 Galpin Blvd
- 22845 Murray St
- 22885 Murray St
- 22780 Murray St
- 22740 22740 Murray St
- 22830 Murray St
- 22740 Murray St
- 6180 Cardinal Ave